


When most people size up a stock, the first thing they look at is the share price. A $20 stock feels cheaper than a $200 one. But that instinct is wrong.
The price of a single share tells you nothing about whether a company is expensive or cheap.
To value a business, you have to compare what it’s worth to what it earns, generates, or owns. That’s the job of valuation ratios — and one of the most respected on Wall Street is EV/EBITDA.
It shows up everywhere: in equity research, in peer comparisons, in mergers and acquisitions, and in conversations between professional investors. Its appeal is simple: it measures what the market is paying for the entire company — debt included — relative to its operating profitability.
In plain terms, EV/EBITDA answers one concrete question: how much is this business worth compared to its ability to generate operating profit, before the big accounting and financing charges?
The formula
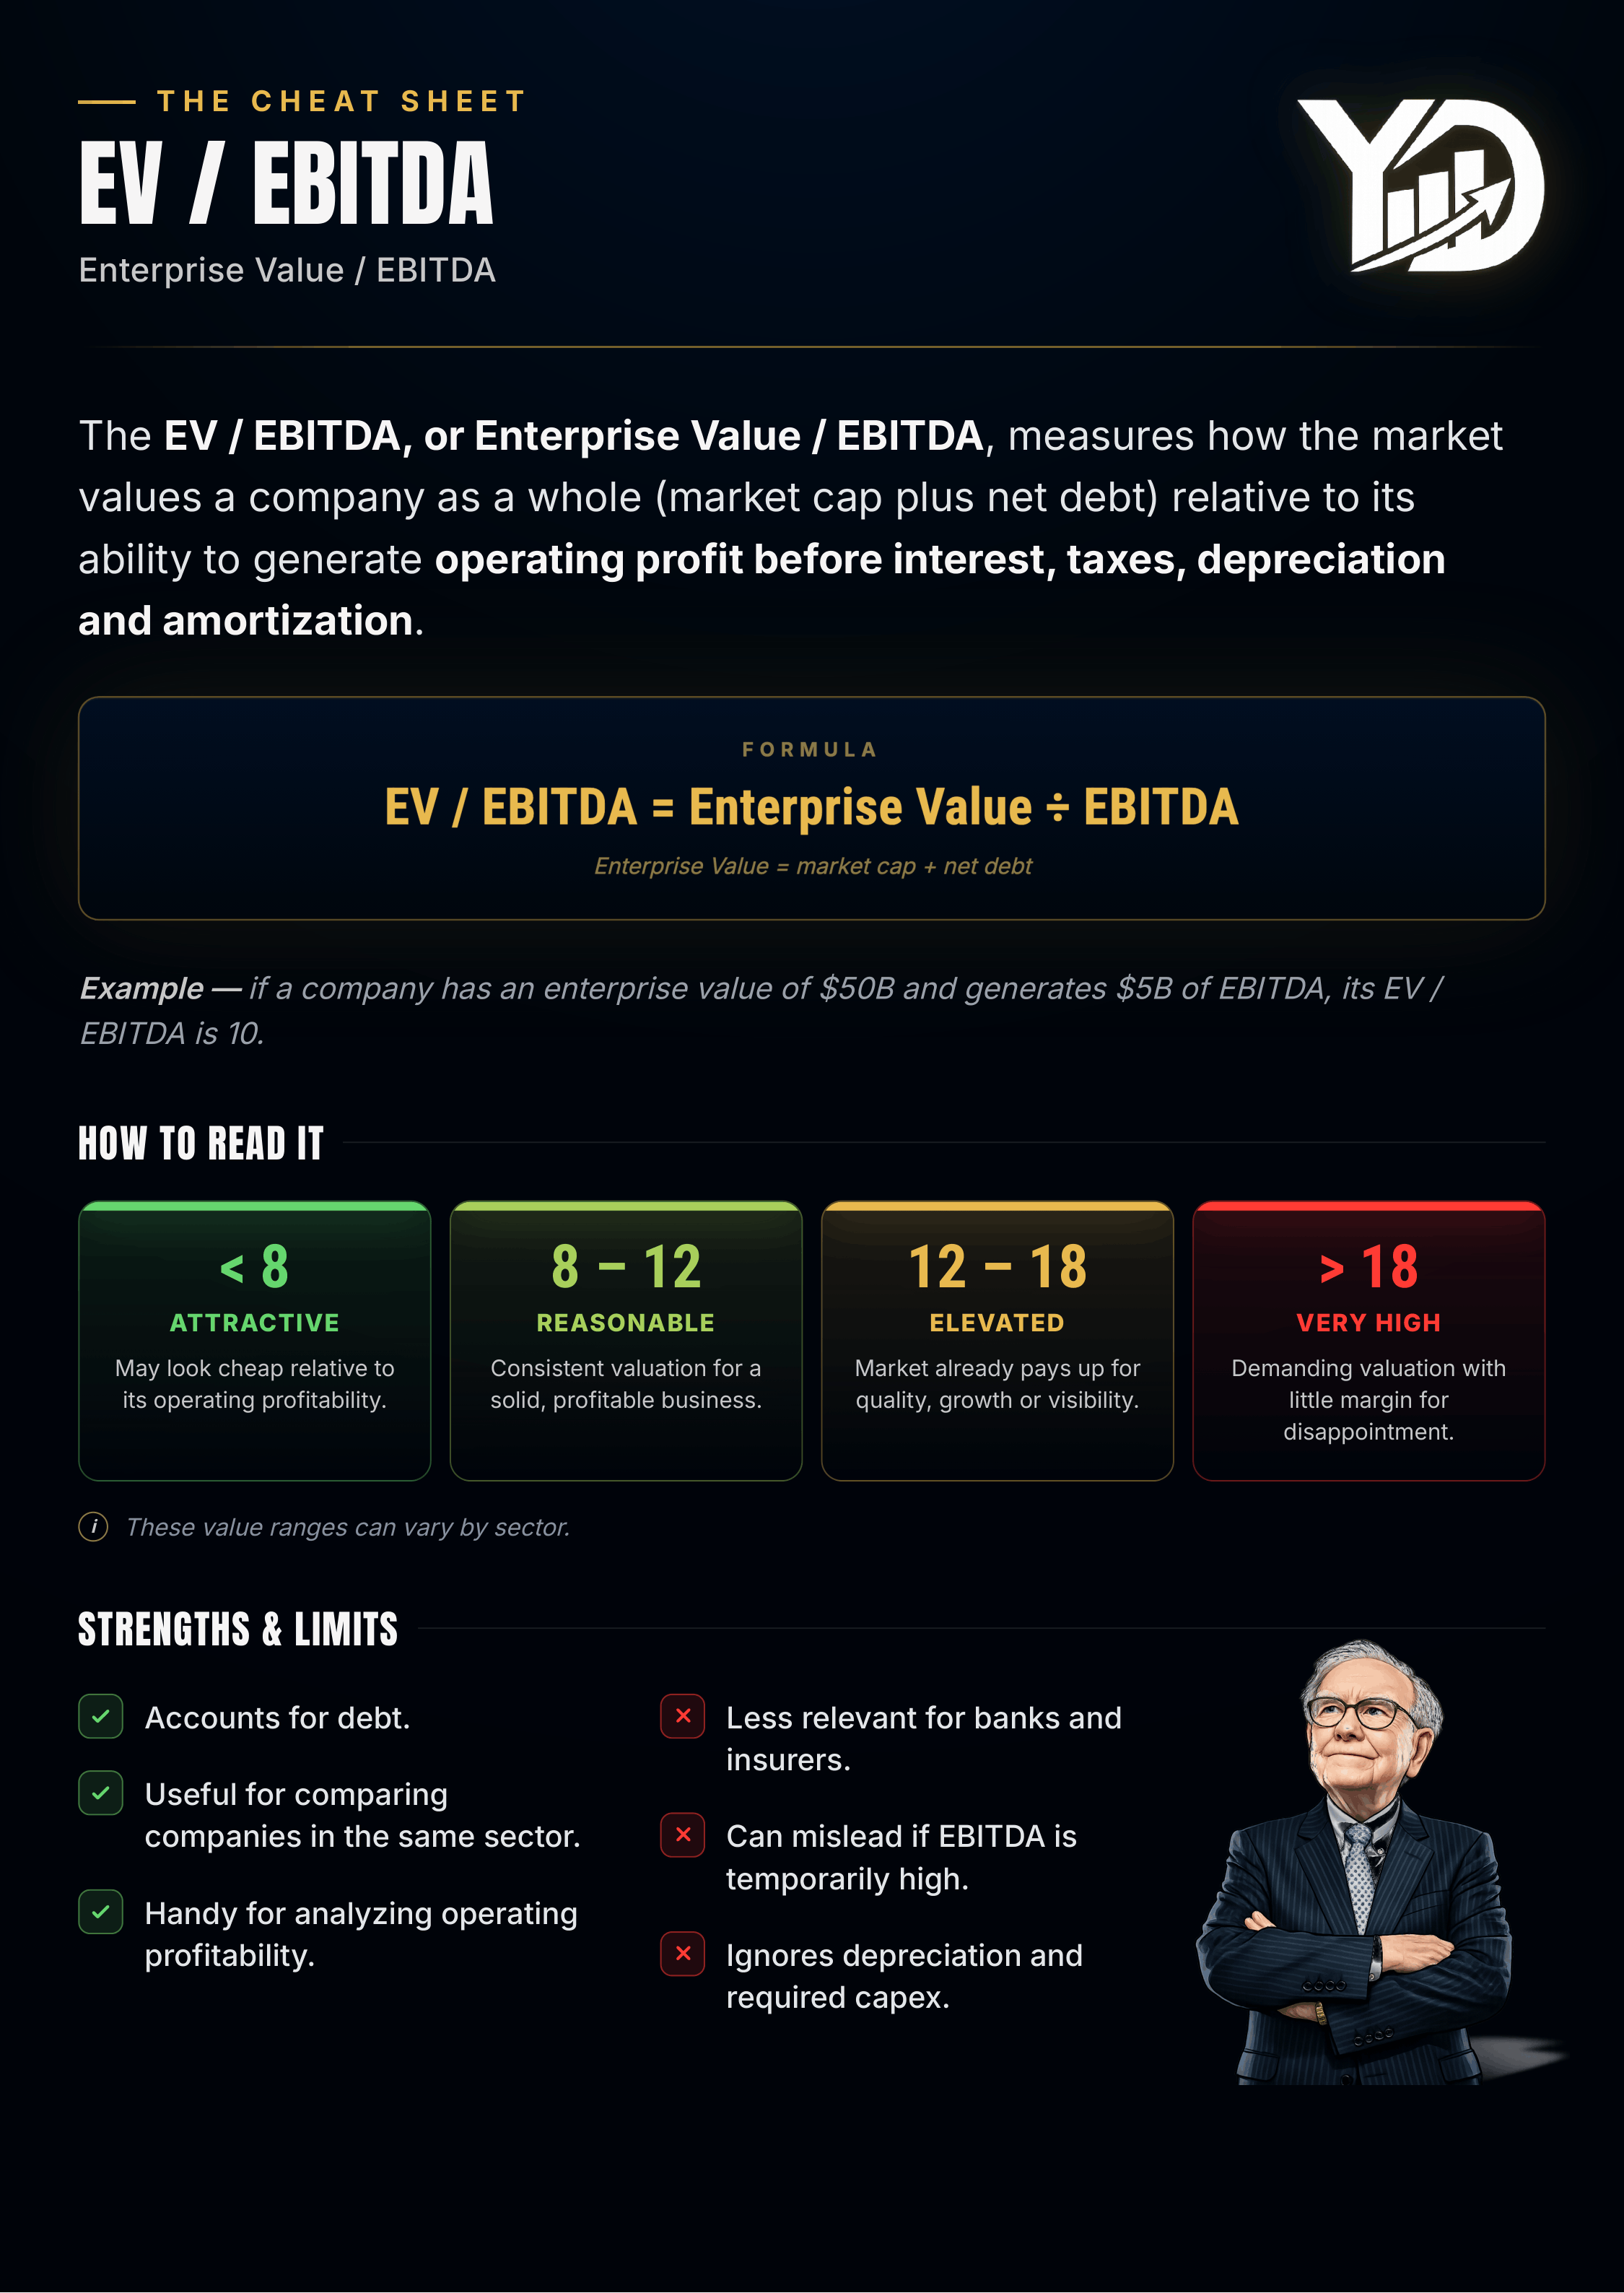
EV/EBITDA = Enterprise Value ÷ EBITDA
Enterprise Value (EV) is the total value of the company to all of its funders — not just shareholders. It doesn’t stop at market cap (the value of the equity). It also accounts for net debt:
Enterprise Value = Market Cap + Net Debt
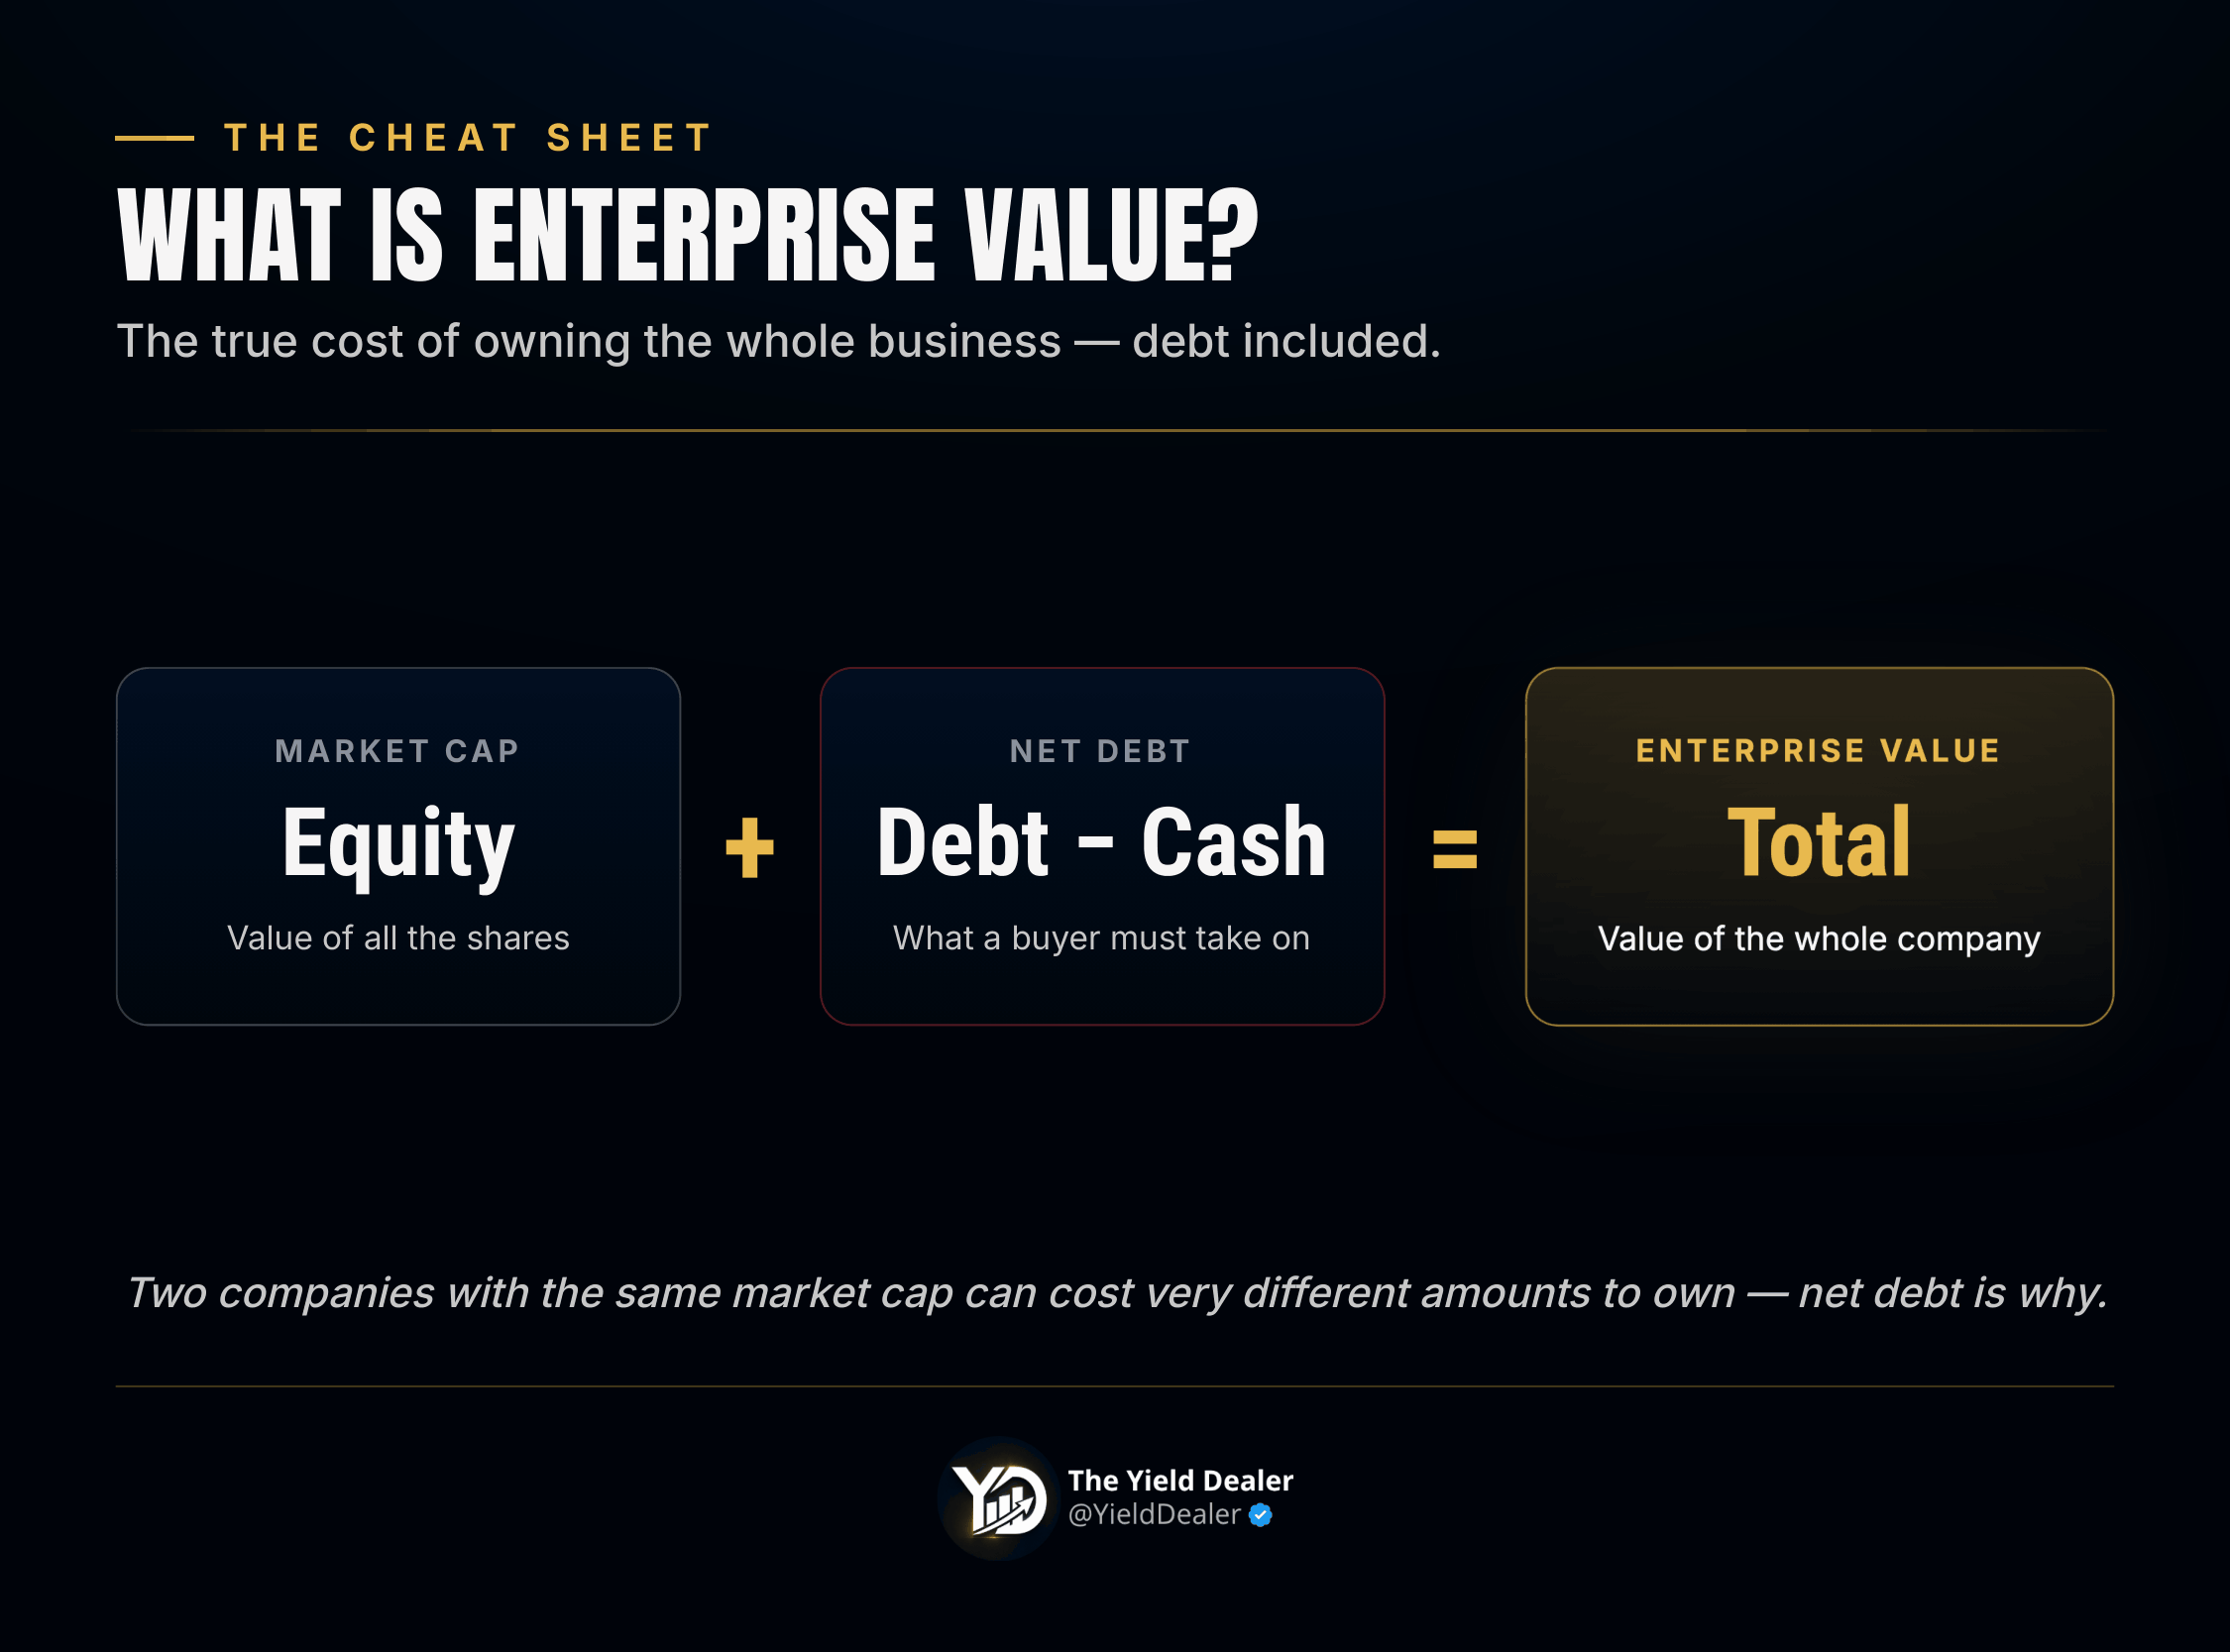
Net debt is generally total financial debt minus available cash. A company with $10B of debt and $3B of cash has $7B of net debt. (A fuller version of EV also folds in minority interests, preferred shares, and certain debt-like obligations — but for an individual investor, the core logic holds: EV measures the total economic value of the business, not just its shares.)
EBITDA is earnings before interest, taxes, depreciation, and amortization. It captures a form of operating profitability before four things: the cost of debt, taxes, and the accounting charges tied to past investments.
Example: A company with an Enterprise Value of $50B generating $5B of EBITDA trades at an EV/EBITDA of 10 — the market values it at 10× its annual EBITDA.
Why use Enterprise Value instead of market cap?
This is where EV/EBITDA really earns its keep.
Market cap only looks at the value of the shares. Two companies can have the same market cap but wildly different debt loads — and to a buyer of the whole business, they don’t cost the same at all.
Picture two companies, each worth $10B on the stock market:
🟢 Company A — no debt, and plenty of cash on hand.
🔴 Company B — $8B of net debt.
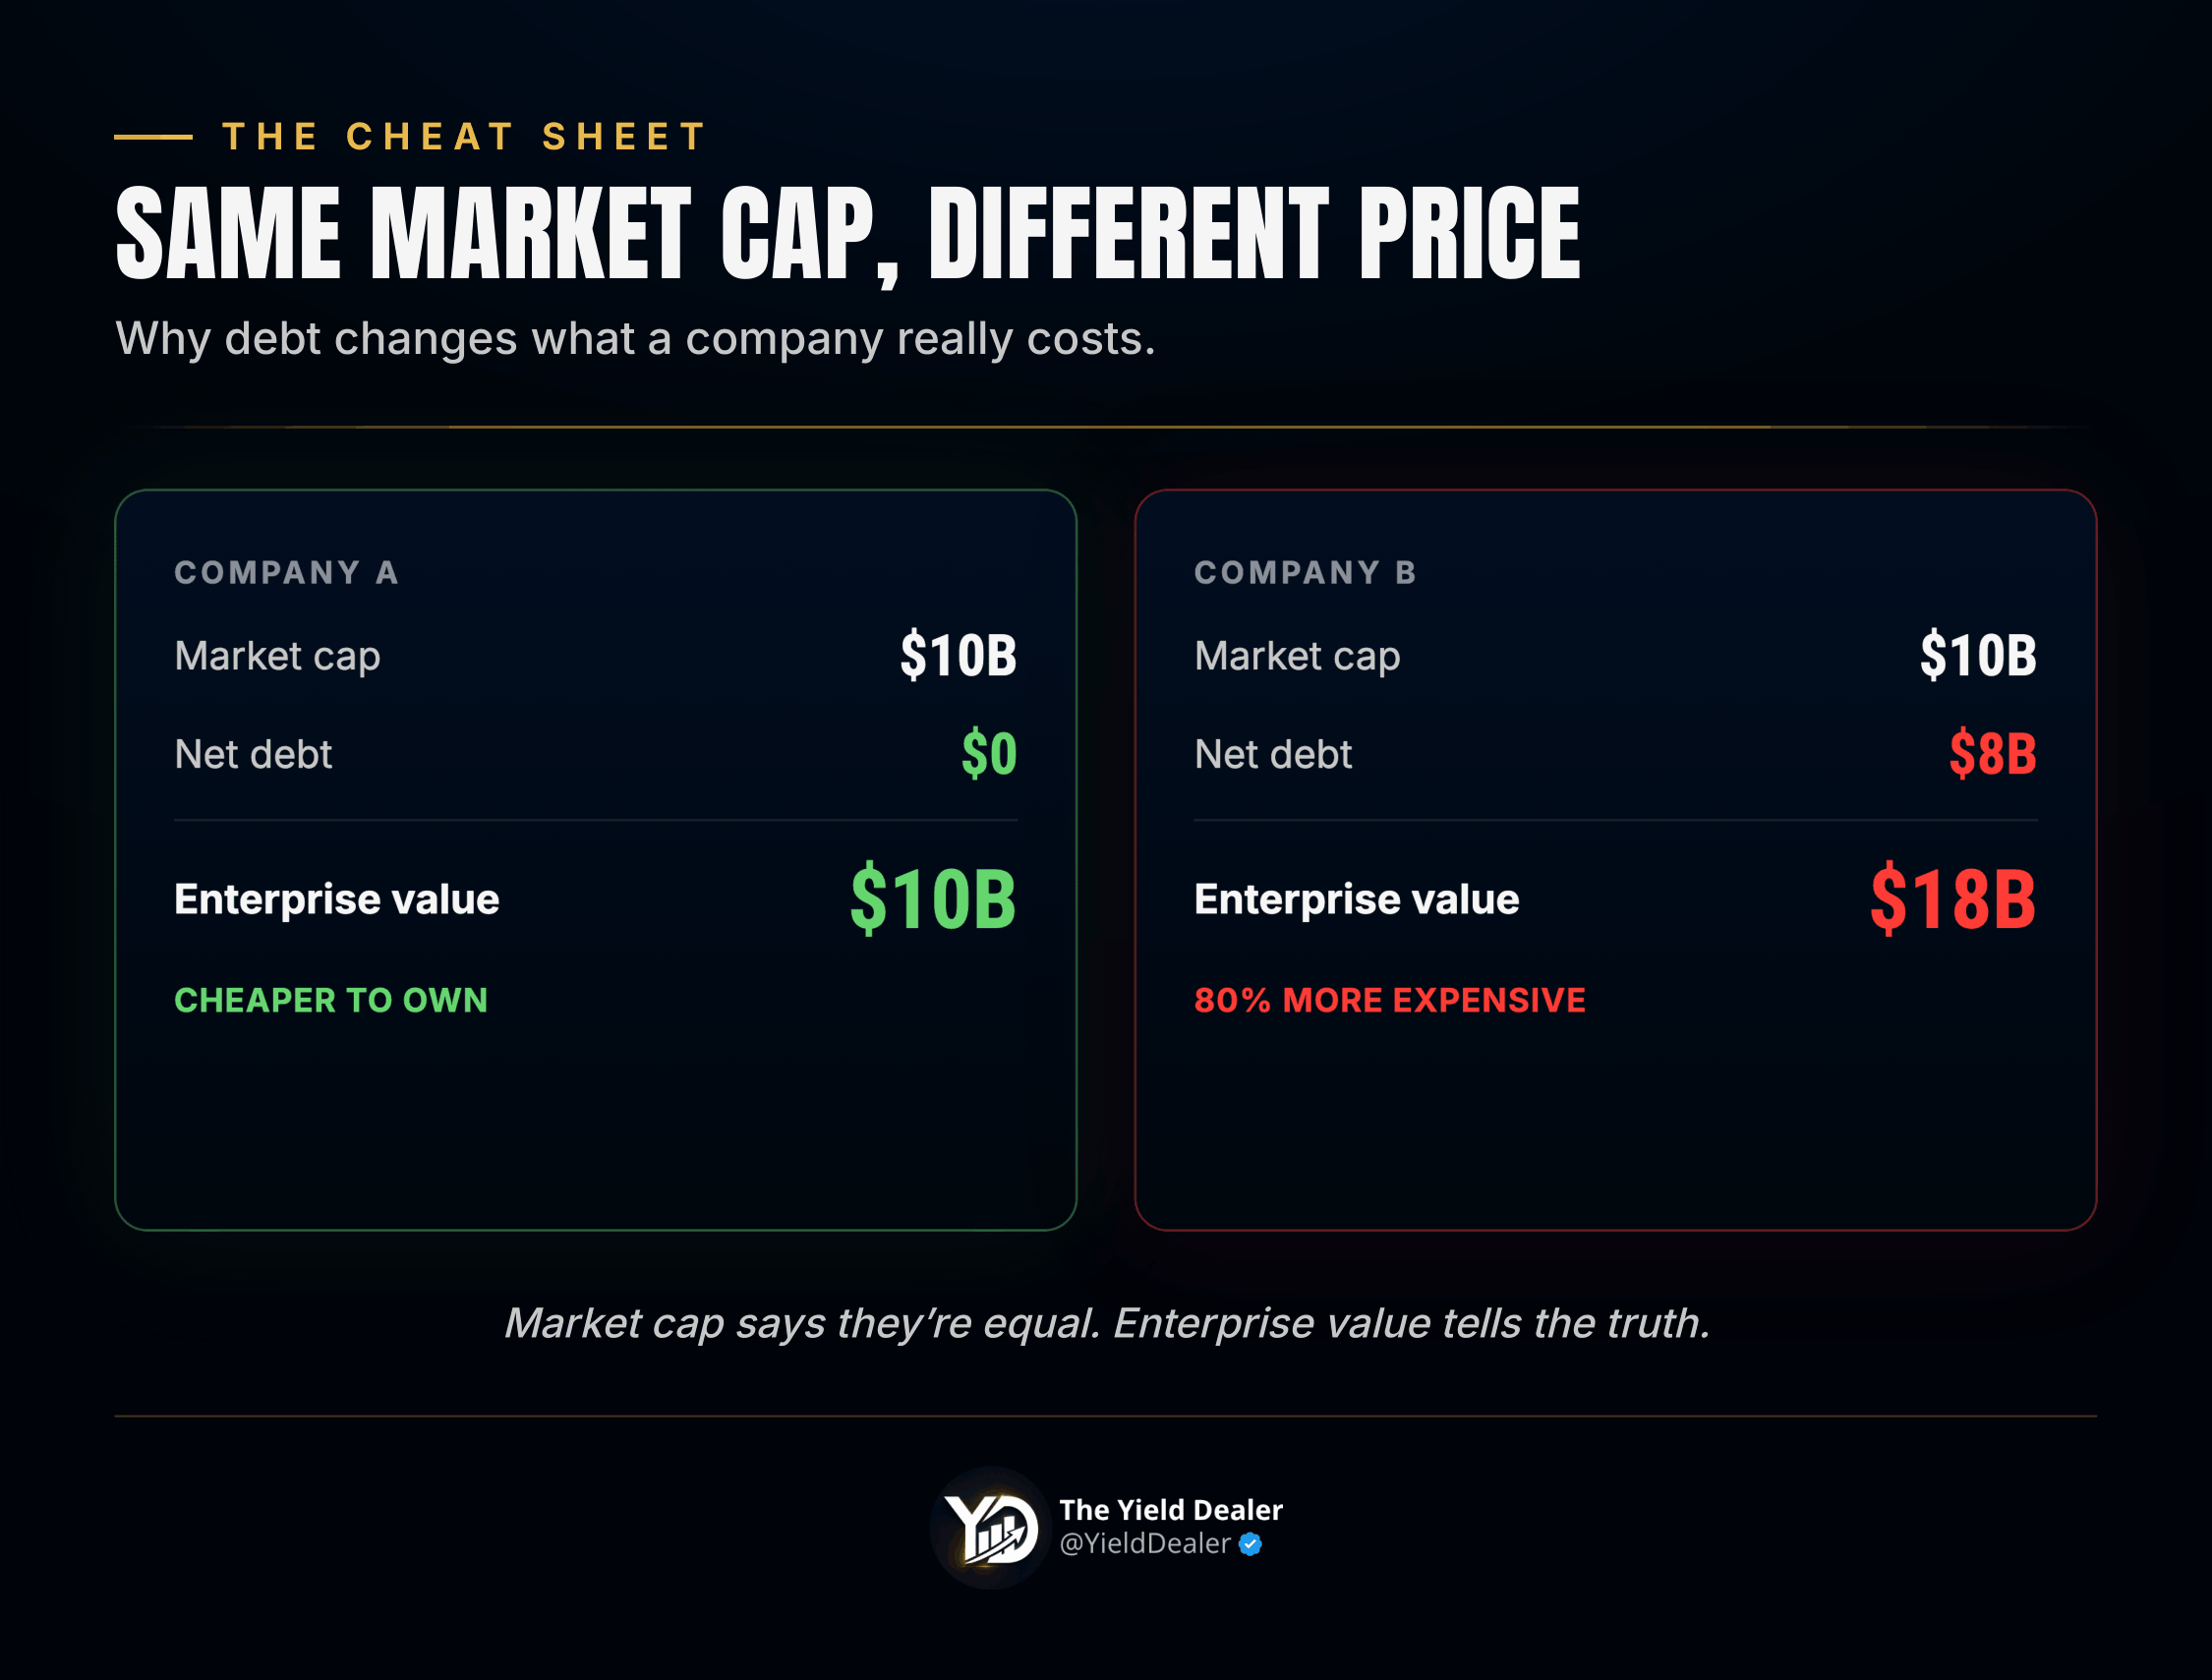
On market cap alone, they look identically priced. But Company B is far more expensive to actually own outright, because a buyer would also have to take on its debt. Enterprise Value corrects exactly for this.
That’s the big edge over a ratio like the P/E, which is based on market cap and net income and can be heavily distorted by leverage. EV/EBITDA lets you compare companies in the same sector but with different debt structures on a fair footing.
What EBITDA actually measures — and what it doesn’t
EBITDA strips out financing choices, taxes, and the accounting cost of past investments, so you can compare the underlying operations of businesses that carry different debt, tax, and investment histories.
But be crystal clear on one point: EBITDA is not free cash flow. This is the single most common mistake investors make.
EBITDA is not free cash flow and that single confusion sinks more investors than any other.
EBITDA ignores the capital spending needed to keep the business running. It also ignores changes in working capital, the taxes actually paid, and the interest on debt. A company can post a huge EBITDA and still generate very little free cash flow if it has to plow money back every year into factories, machines, networks, planes, stores, or infrastructure.
That’s precisely why EV/EBITDA is useful, but never sufficient.
How to read an EV/EBITDA
As a rough guide, the lower the multiple, the cheaper the company looks relative to its operating profit; the higher it is, the more the market is paying up.
⭐ Below 8 — potentially attractive; may be reasonably priced or even undervalued.
🟢 8 – 12 — reasonable for a solid, profitable business with decent prospects.
🟡 12 – 18 — demanding; the market is already paying for quality, visibility, or growth.
🔴 Above 18 — expensive. Not automatically overpriced, but expectations are high — the company has to justify it with strong growth, excellent economics, or very durable margins.
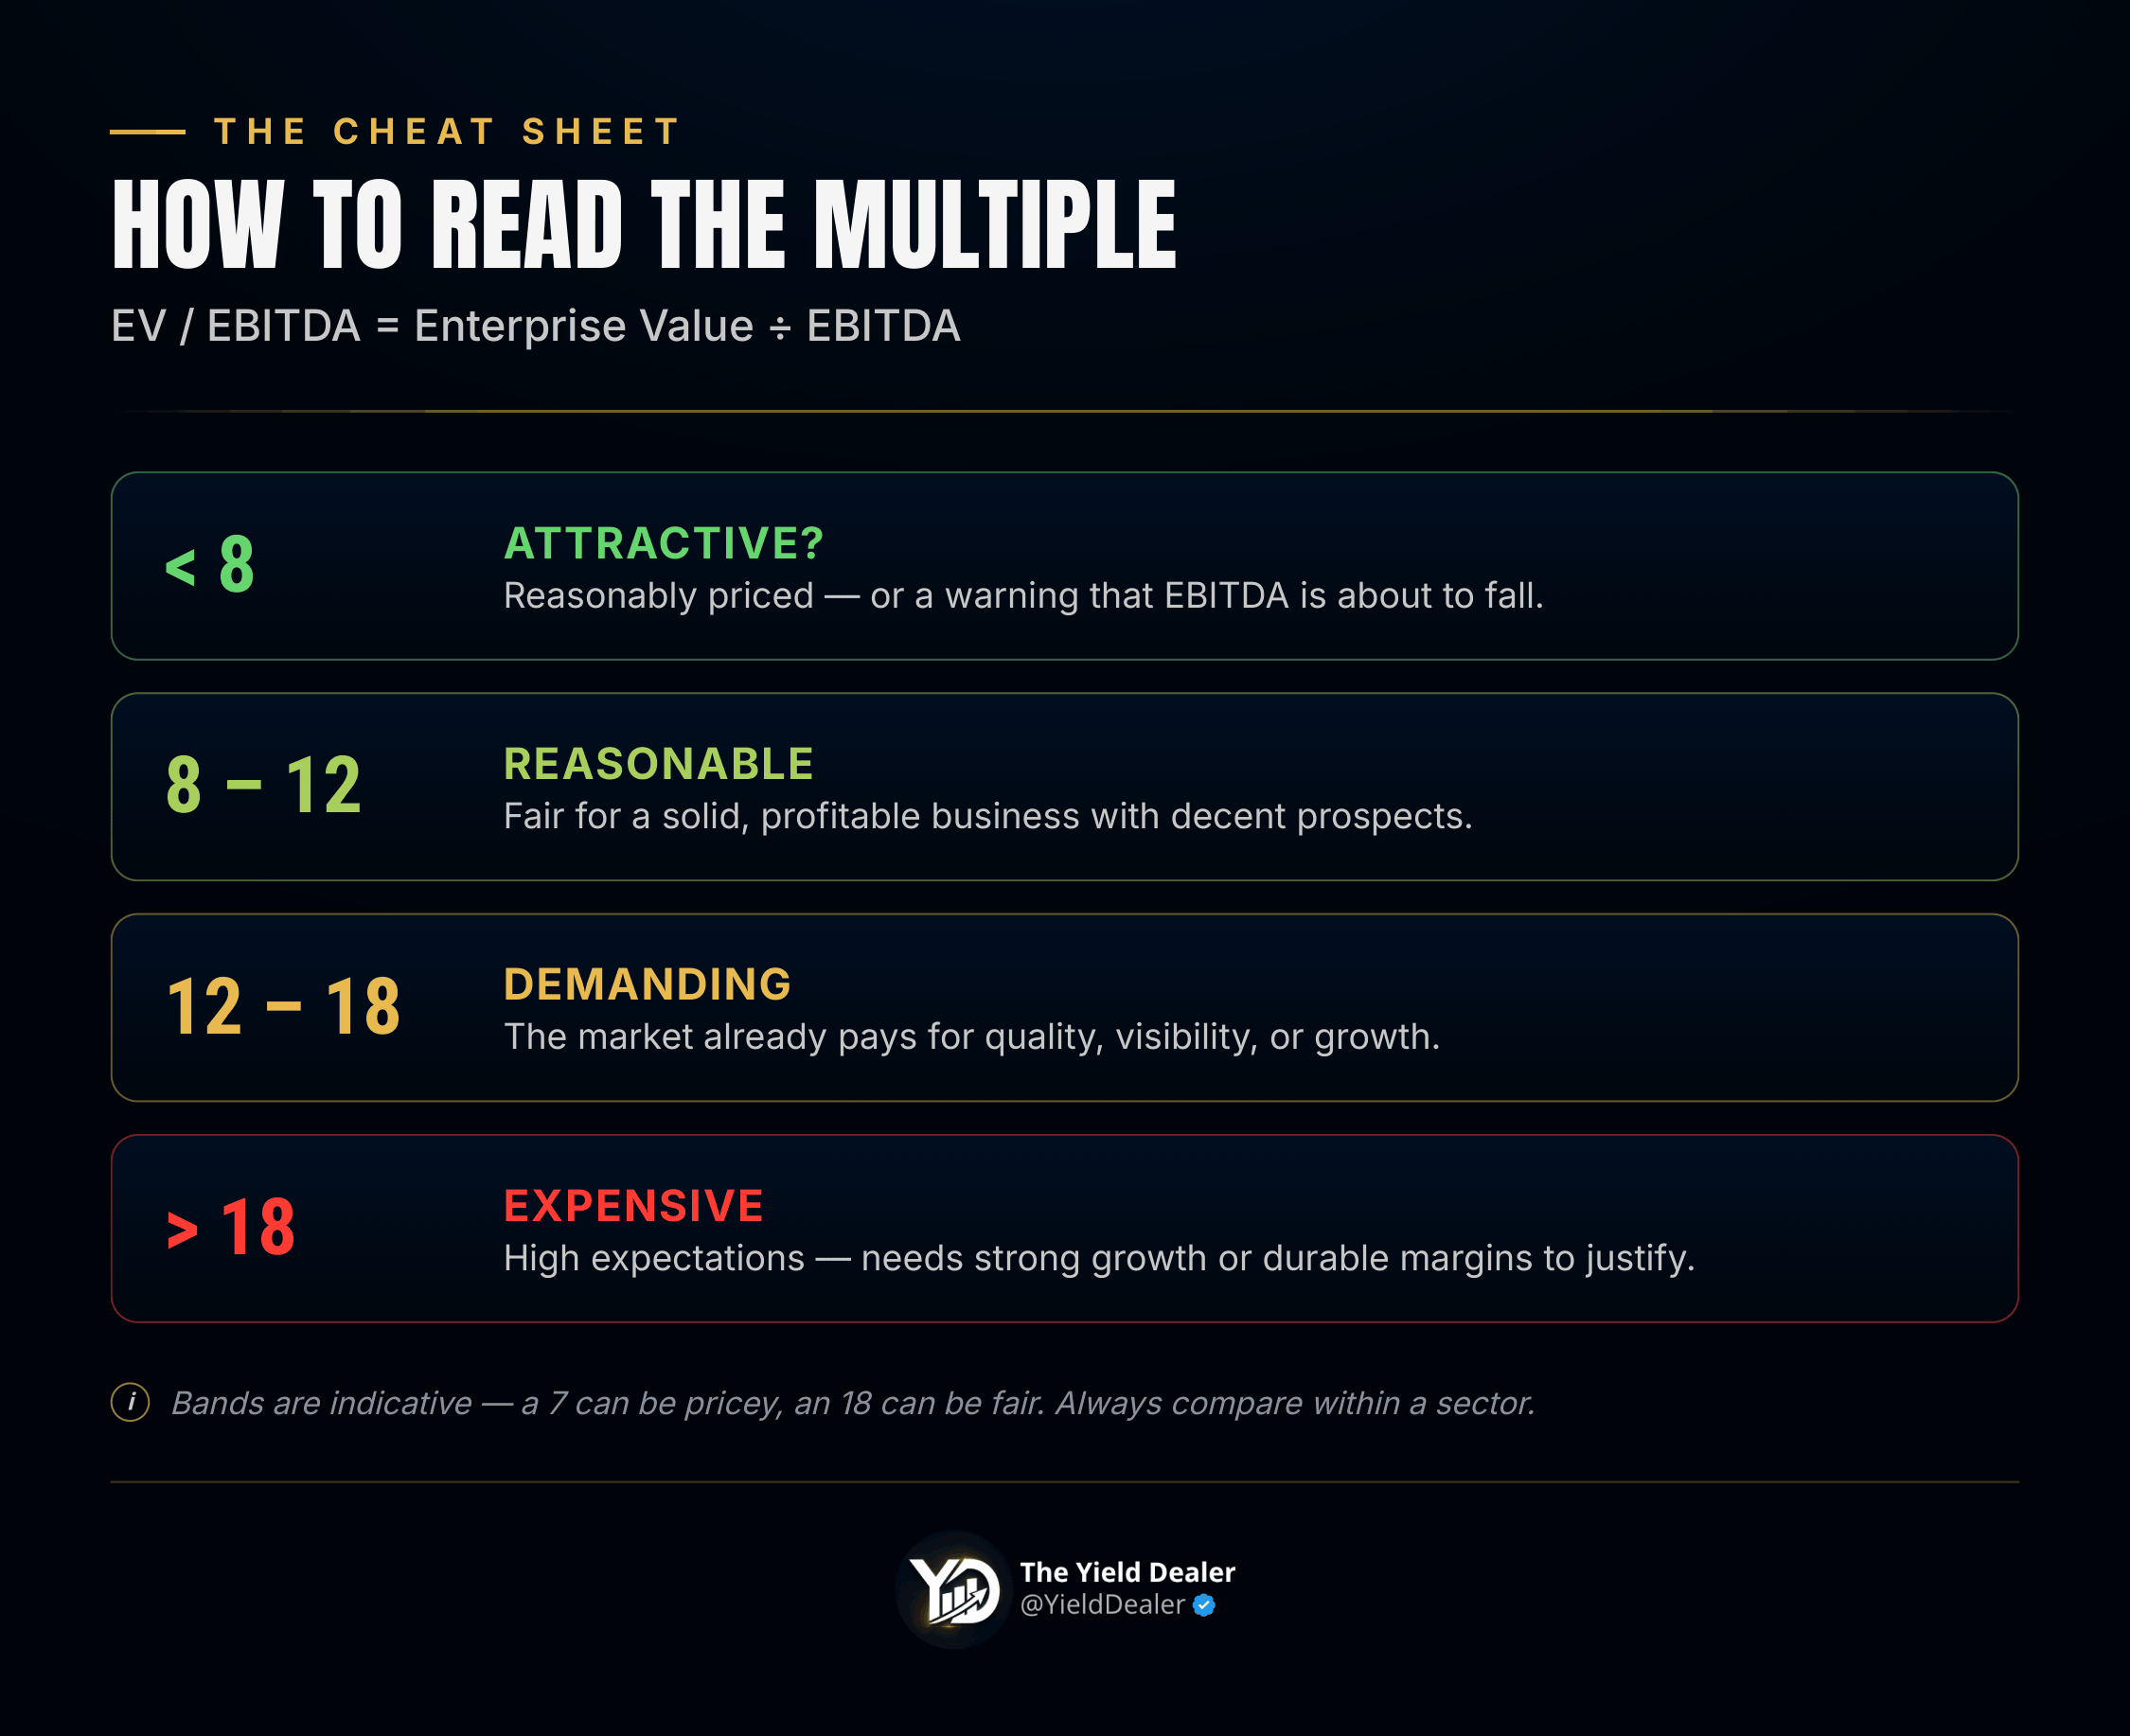
Use these bands with caution — they aren’t universal. A 7× can be expensive for a declining, highly cyclical, or heavily indebted business. An 18× can be perfectly fair for an exceptional, low-risk company that can grow strongly for years. The number alone never decides; you have to understand what’s behind it.
A low ratio isn’t automatically a bargain
This is the most common trap. When a company trades at 5–6× EBITDA, it can look like it’s on sale. Sometimes it genuinely is — the market can overdo the pessimism or temporarily abandon a sector. But a low multiple can just as easily be a warning: the market may be anticipating a drop in EBITDA from a business that’s losing share, facing margin pressure, being disrupted, or carrying too much debt.
In cyclical sectors the trap is even sharper. A company can look dirt cheap at the top of the cycle, precisely because its EBITDA is temporarily inflated — think commodities, energy, chemicals, shipping, autos, or construction. When prices are high and margins are fat, EBITDA spikes and the multiple looks low. If the cycle turns, EBITDA collapses, and the “cheap” multiple was an illusion.
A low EV/EBITDA should always trigger one question: why is the market valuing this business so cheaply?
A high ratio isn’t automatically excessive
The reverse is equally true. A high EV/EBITDA doesn’t automatically mean the stock is too expensive.
Some companies deserve a premium — durable growth, high margins, a strong competitive position, excellent revenue visibility, or a resilient business model. A company that grows fast, expands margins, and converts most of its EBITDA into free cash flow can justify an above-average multiple. That’s often the case in software, healthcare, professional services, premium consumer, and digital platforms with real pricing power.
But stay disciplined: the higher the multiple, the smaller your margin for error. If growth slows or forecasts are cut, the market can re-rate the valuation brutally. A great company can still be a poor investment if you overpay.
Why professionals love it
It handles different debt levels. Because EV includes net debt, the ratio gives a fuller picture than market cap alone.
It neutralizes depreciation differences. Two firms with different asset ages or accounting methods become more comparable once depreciation is set aside.
It’s built for M&A. An acquirer looks at the total price to pay — debt included — against operating profitability.
It’s simple. It gives a fast read on the price paid for operating profit.
That simplicity explains its popularity. It also explains its dangers.
The big limitation: EBITDA ignores necessary investment
Not every company has the same capital needs. A software firm can throw off high EBITDA with little physical investment. An airline, a telecom operator, a heavy industrial, or an energy company often has to invest enormously just to maintain its assets.
Two companies can show the same EBITDA and generate completely different cash for shareholders:
🟢 Company A — $1B EBITDA, needs $100M/year of capex to stay competitive.
🔴 Company B — $1B EBITDA, needs $700M/year.
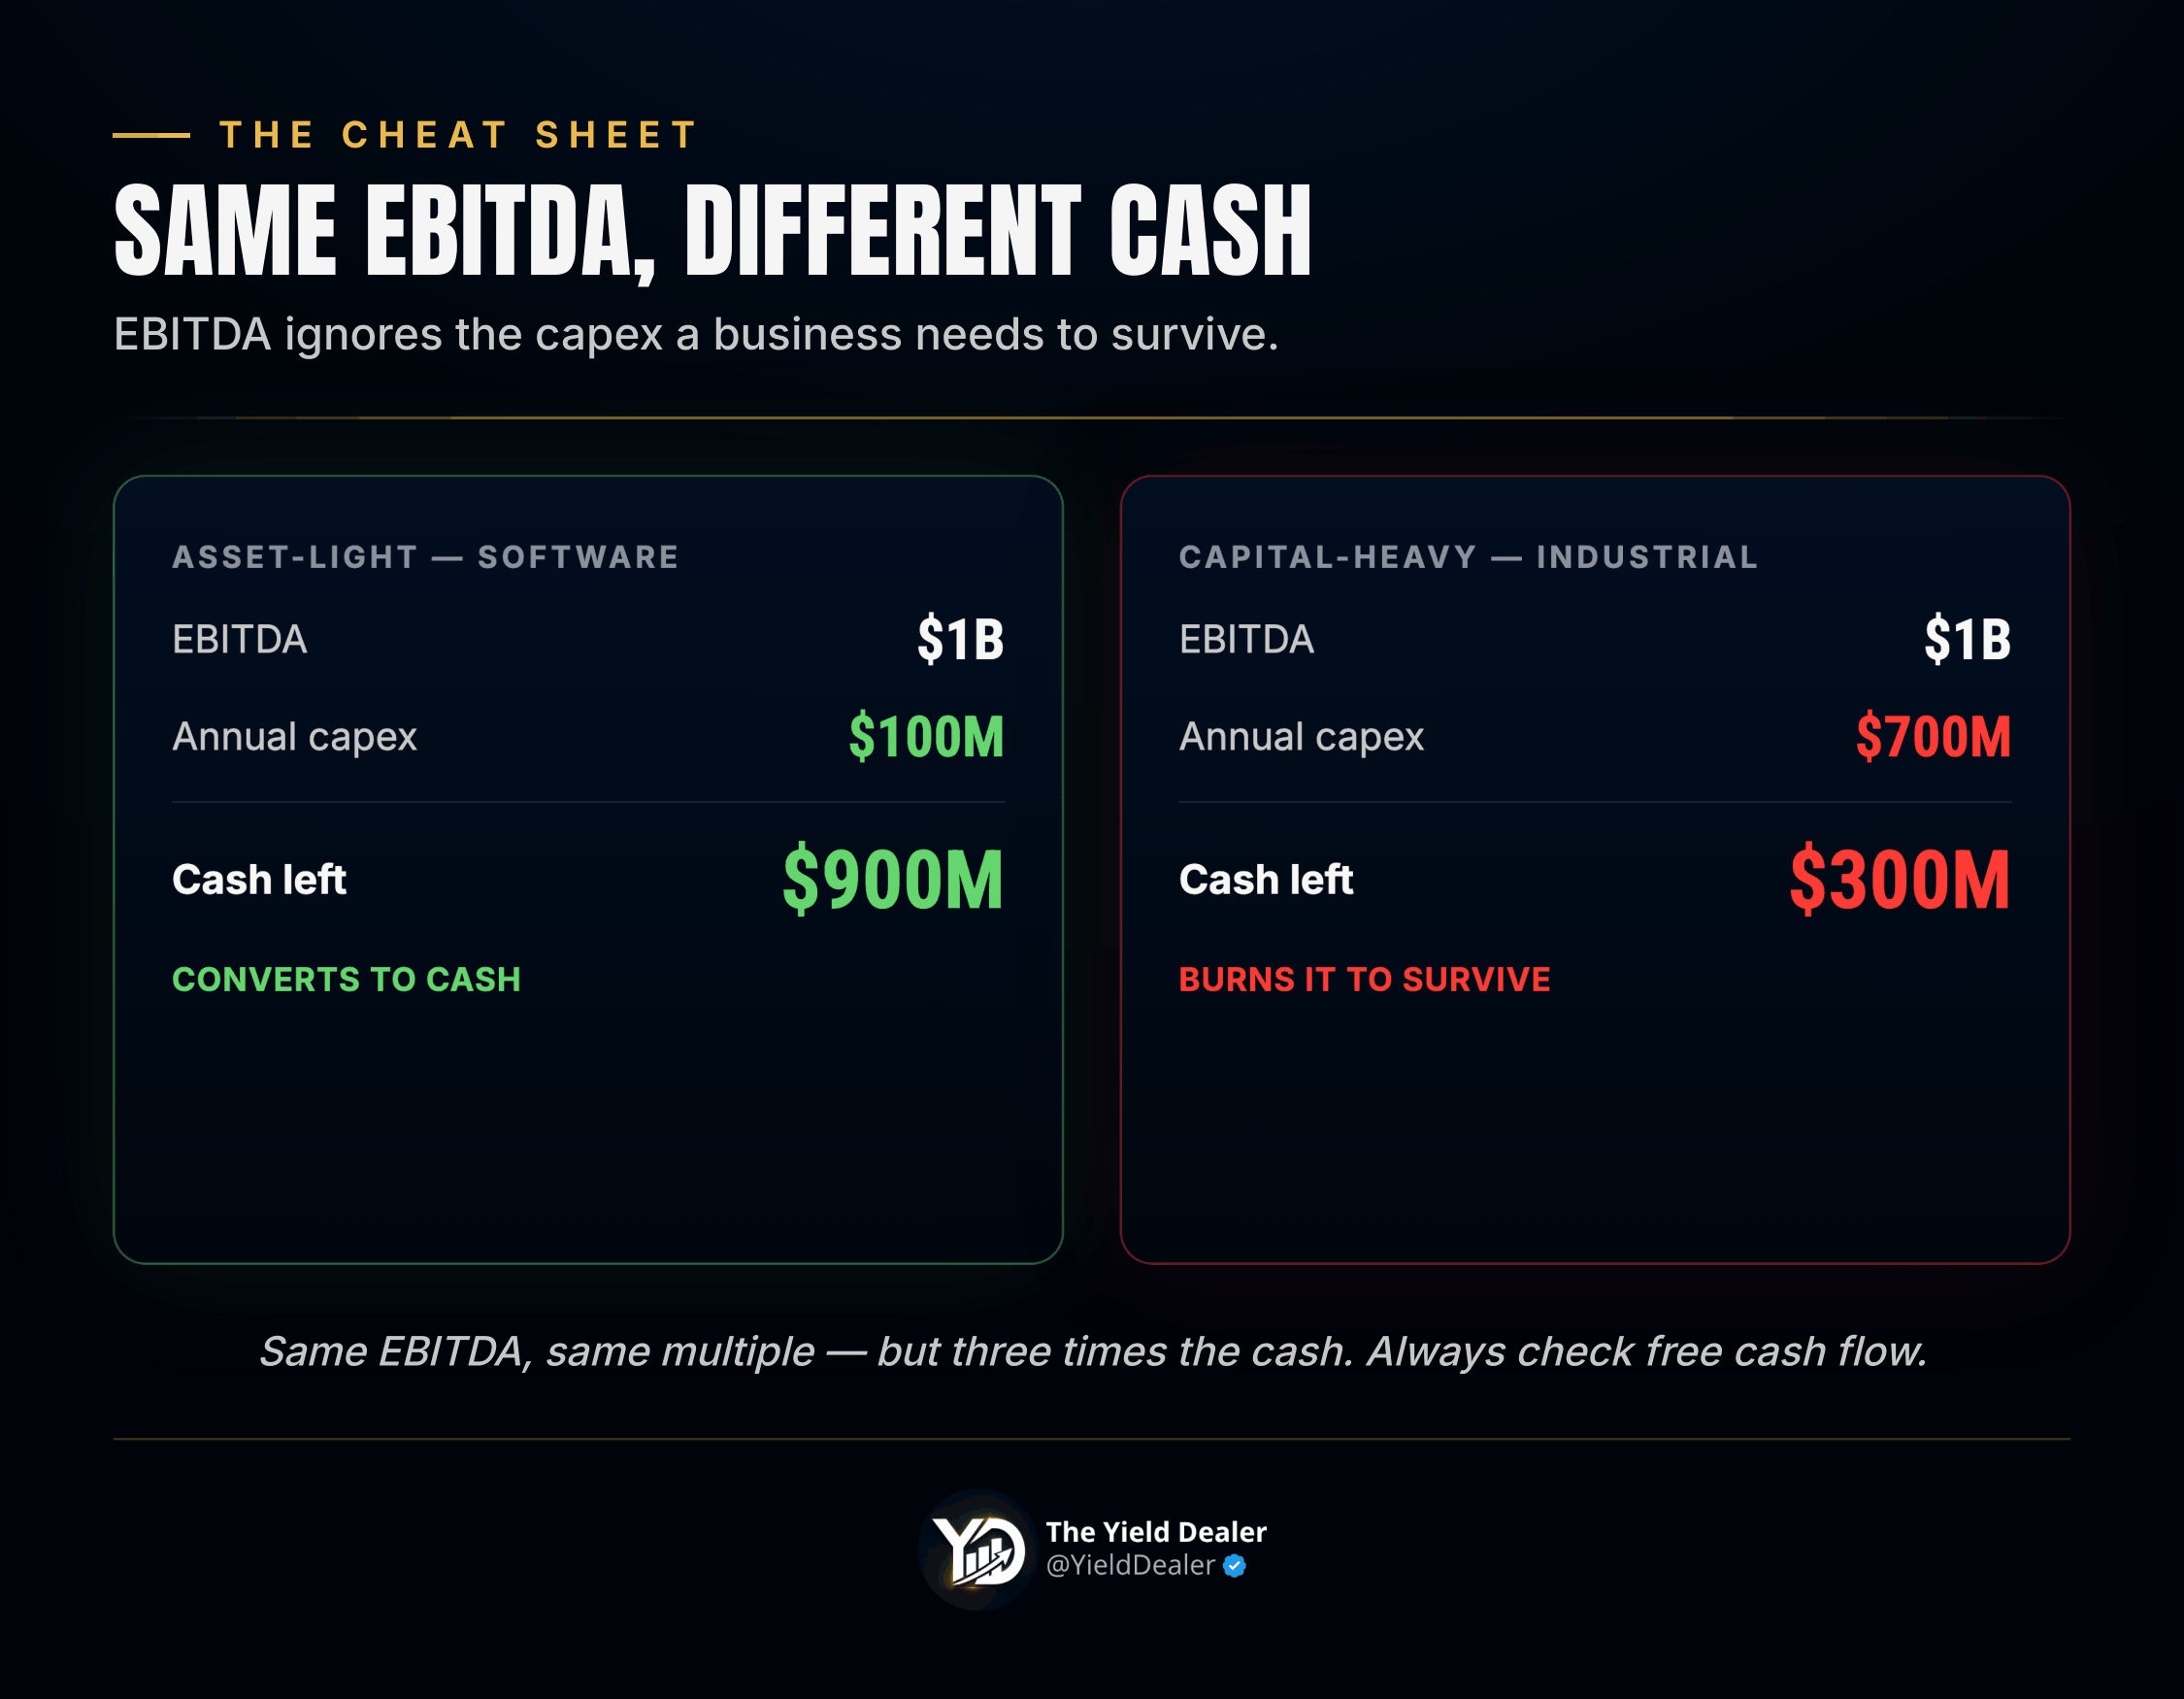
Same EBITDA, very different economic reality. Company A converts most of it into cash; Company B burns most of it just to keep the lights on. If both trade at 10× EBITDA, they are not equally valued — A may be reasonable, B may be expensive. Always pair EV/EBITDA with a look at free cash flow.
High EBITDA ≠ a financially sound company
EV/EBITDA folds debt into the numerator — an advantage — but it doesn’t tell you whether that debt is sustainable. A company can look fairly valued at 8× EBITDA and still be dangerously levered. If EBITDA dips even slightly, interest costs and maturities can turn a stable business fragile.
So read it alongside balance-sheet metrics: Net Debt/EBITDA, interest coverage, the debt maturity schedule, cash on hand, and the stability of cash flows. EV/EBITDA is a valuation signal — it doesn’t replace balance-sheet analysis.
Which EBITDA are you using?
The ratio is highly sensitive to the EBITDA figure you plug in.
Trailing EV/EBITDA — based on the last twelve months (can be skewed by an exceptional year).
Forward EV/EBITDA — based on expected EBITDA (only as reliable as the forecast).
Forward multiples matter because markets price the future — but if analysts are too optimistic, the ratio looks falsely reassuring. A stock can seem reasonable at 10× next year’s EBITDA, but if that number is never hit, the real multiple was higher. Always ask whether the EBITDA is normal, durable, cyclical, one-off, or forecast.
Compare only comparable companies
EV/EBITDA is most useful within a sector. Comparing a telecom operator to a software vendor makes little sense — their margins, capital needs, cyclicality, growth, and balance sheets are too different. A telecom might trade at 6–8× while mature and capital-heavy; a software company might trade at 20× because it grows fast, generates lots of cash, and needs few physical assets.
The right method: compare a company to its direct competitors, its own historical average, and its sector’s typical range. A stock can look expensive versus the whole market yet reasonable versus its peers — or cheap versus the market yet expensive versus the real quality of its business.
EV/EBITDA vs P/E — two different questions
The P/E compares market cap to net income — well known, but influenced by debt, taxes, exceptional items, and depreciation. EV/EBITDA compares the total value of the business to operating profit before interest, taxes, and depreciation.
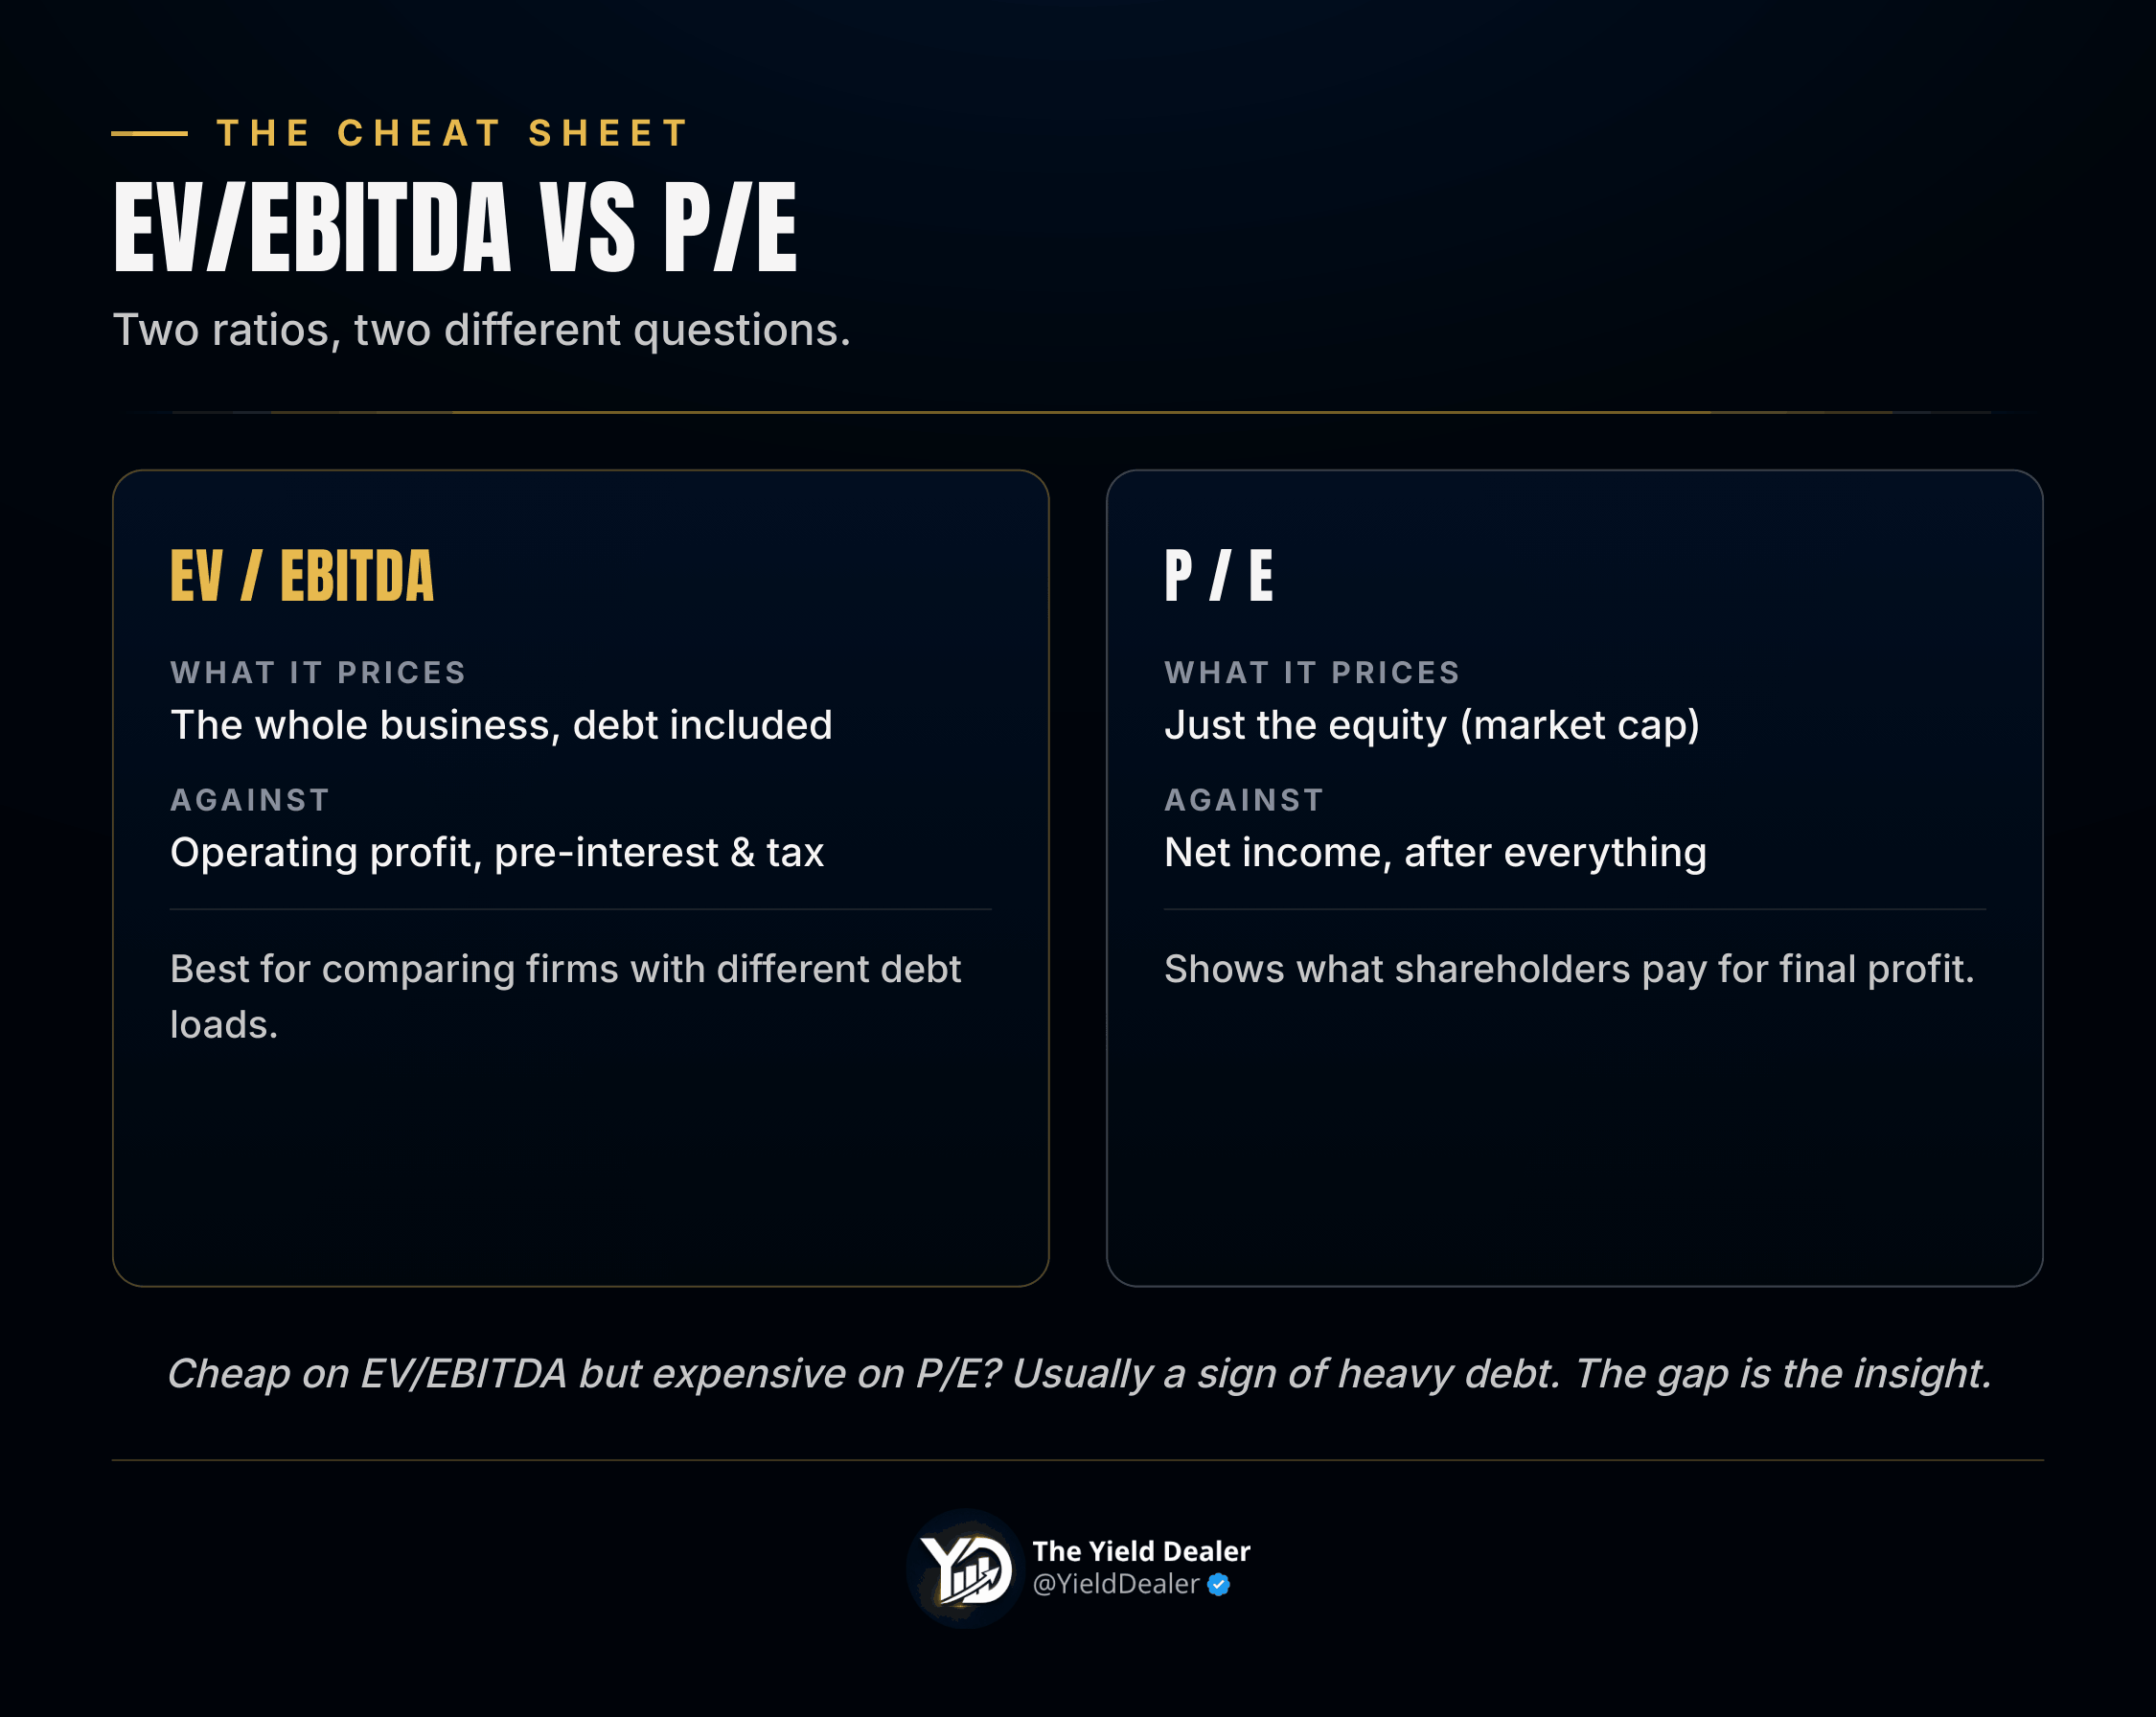
The P/E asks what shareholders pay for the profit that reaches them. EV/EBITDA asks what the whole business costs relative to its operating profitability. In practice, look at both. If a company looks cheap on EV/EBITDA but expensive on P/E, the culprit is often heavy debt, high interest, big depreciation, or an unfavorable tax rate. Divergences between ratios are often more revealing than the ratios themselves.
EV/EBITDA, EV/EBIT, and P/FCF — which to favor?
EV/EBITDA tends to be lenient with companies that carry heavy depreciation and capex. That’s why some investors also look at:
EV/EBIT — includes depreciation, so it’s closer to the true operating result after the accounting wear-and-tear of assets. Often more relevant for industrial or capital-heavy firms.
P/FCF or EV/FCF — go further still, comparing valuation to the cash actually left after investment. Closest to the shareholder’s real economics — but more volatile year to year.
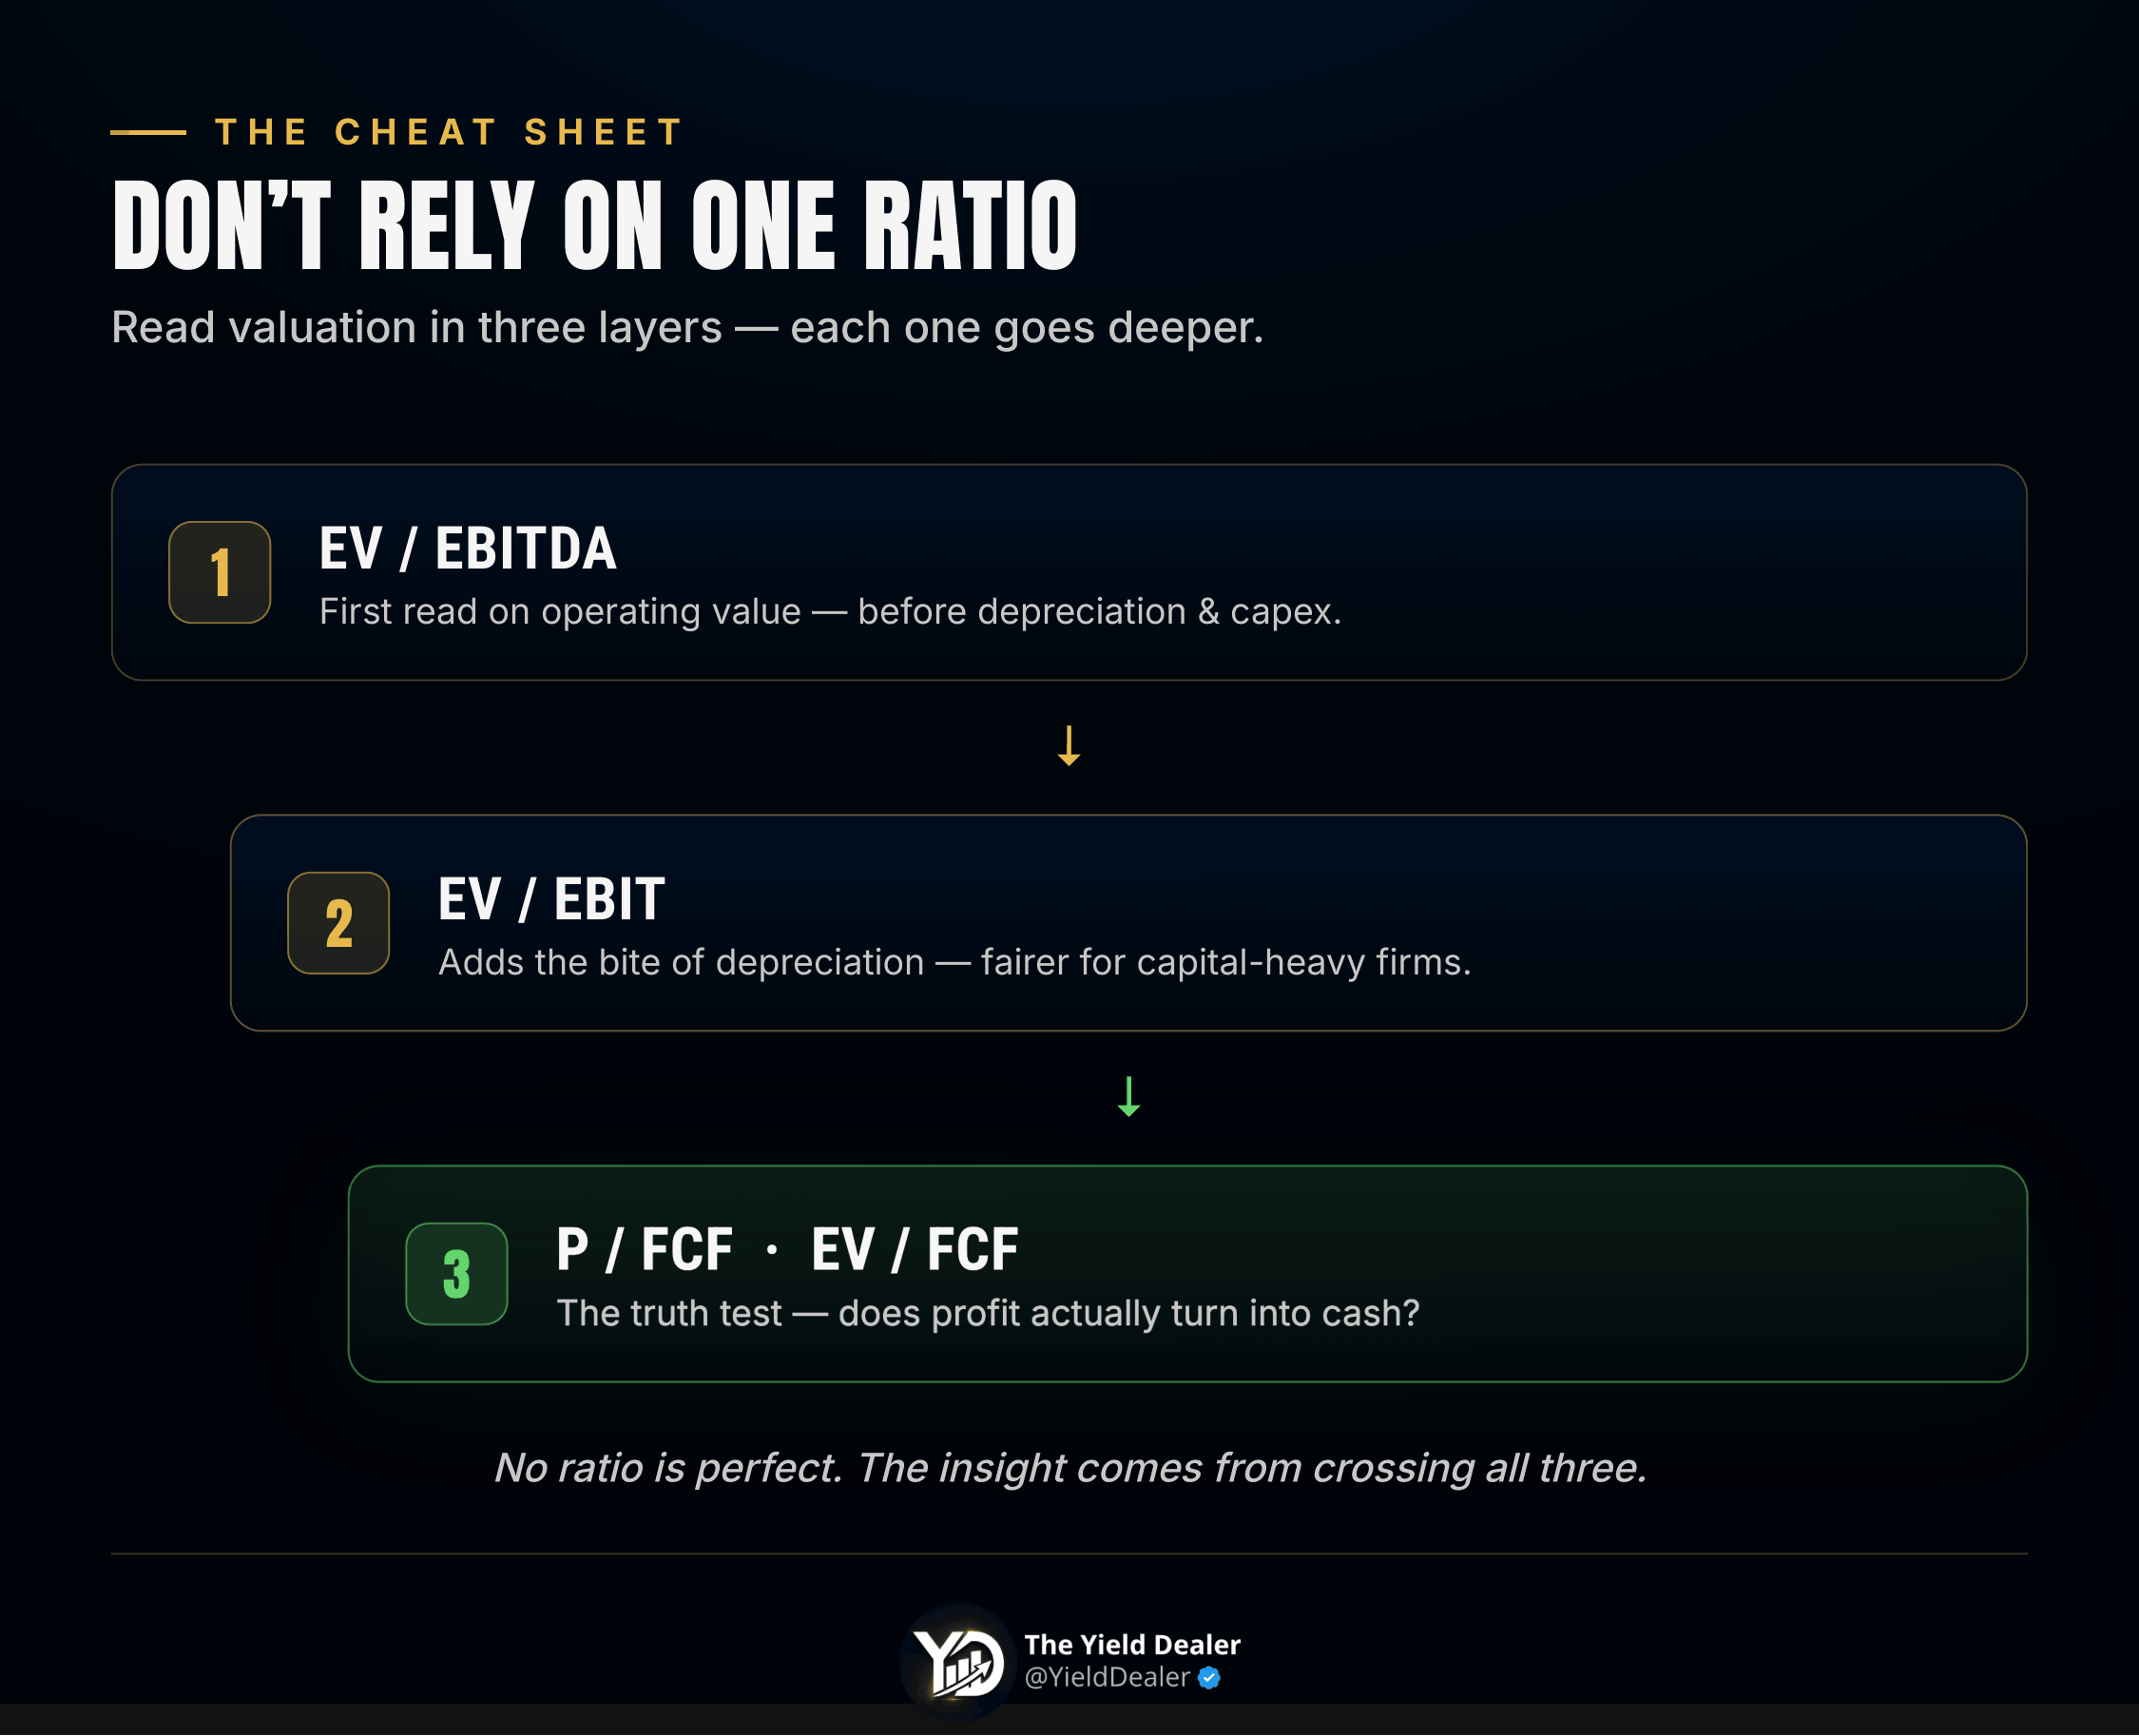
There is no perfect ratio. The answer is to triangulate: EV/EBITDA for the first read on operating value, EV/EBIT to add depreciation’s bite, and P/FCF to check whether that profitability truly becomes cash.
The special case of banks and insurers
EV/EBITDA is largely useless for banks, insurers, and most financial companies. Their model is different — for a bank, debt isn’t a financing choice, it’s the raw material of the business, and interest sits at the heart of operations. EV and EBITDA lose their meaning.
For banks, look instead at Price/Book, return on equity, loan-book quality, cost of risk, net interest margin, and solvency ratios.
For insurers, look at the combined ratio, return on equity, capital generation, investment-portfolio quality, and balance-sheet strength.
EV/EBITDA is excellent for many industrial, tech, consumer, and services businesses — but it is not universal.
How to actually use EV/EBITDA in an analysis
Check the current level. Is it trading at 6×, 10×, 15×, or 25×? A fast read on where valuation sits.
Compare to its own history. Cheaper or richer than its multi-year average? If the multiple has dropped sharply, is the market overdoing the pessimism — or are prospects genuinely deteriorating?
Compare to direct competitors. A premium to peers must be earned: better growth, higher margins, a stronger balance sheet, better visibility, or better EBITDA-to-cash conversion.
Judge the quality of the EBITDA. Stable? Cyclical? Growing? Propped up by a temporary effect or by accounting adjustments?
Check the cash conversion. A company with lots of EBITDA but little free cash flow deserves a discount to one that turns EBITDA into cash efficiently.
Bottom line
EV/EBITDA is one of the essential valuation ratios — simple, useful, and powerful when used well. It lets you look at a company as a whole, debt included, against its operating profitability.
But it doesn’t say everything. It doesn’t directly measure the cash available to shareholders. It ignores necessary investment. It can mislead in cyclical sectors. It’s poorly suited to banks and insurers. And it can be flattered by over-optimistic adjustments.
So treat it as a starting point. It quickly flags whether a business looks expensive, reasonable, or cheap. Then go deeper — debt, margins, capex, cash conversion, cyclicality, management quality, and growth outlook.
EV/EBITDA helps answer one essential question: how much is the market valuing the whole business relative to its operating profitability? That’s a great question. But before you commit real money, it must always be joined by another: is that profitability durable, convertible into cash, and bought at a reasonable price?


Want to get The Yield Dealer’s Newsletter in your inbox? Join other readers here.
Want short ideas on living and working on your own terms? Follow me on X/Twitter and Instagram.