


October has a reputation for crashes. History tells a more interesting story: volatility, turning points, and a transition into one of the strongest seasonal periods of the year. Here’s what I’m watching as we enter October 2026.
October has always had a strange place on the stock market calendar. It’s one of those months investors tend to fear, yet it has also been a month of some important market recoveries.
The reputation is easy to understand. The stock market crashes of 1929 and 1987 both happened in October, while the 2008 financial crisis produced one of the most violent weeks in modern market history during the month. On October 19, 1987, the Dow Jones Industrial Average fell 22.6% in a single session. During the week ending October 10, 2008, the Dow lost approximately 18.2%.
Those events happened. They were also extreme outliers.
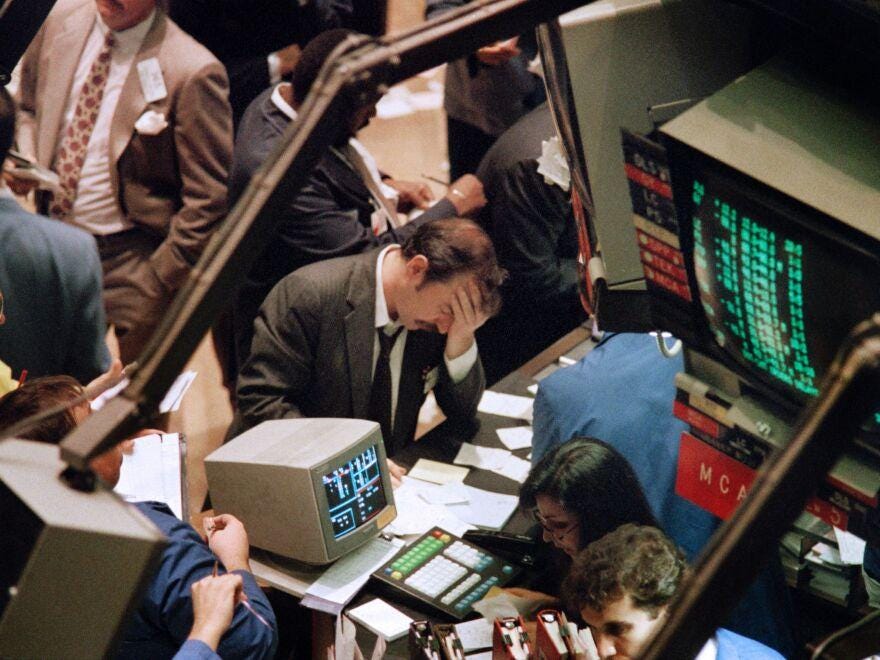
The problem is taking a handful of spectacular historical events and turning them into a rule about an entire month.
For investors, October is a lot more interesting than its reputation suggests.
Subscribe for free to receive independent market analysis and practical investing insights.
October isn’t historically a bad month
Look past the headlines and the picture changes.
Since 1950, the S&P 500 has gained an average of roughly 0.9% in October, according to historical data compiled by Stock Trader’s Almanac. The index has finished October higher in about 59% of years.
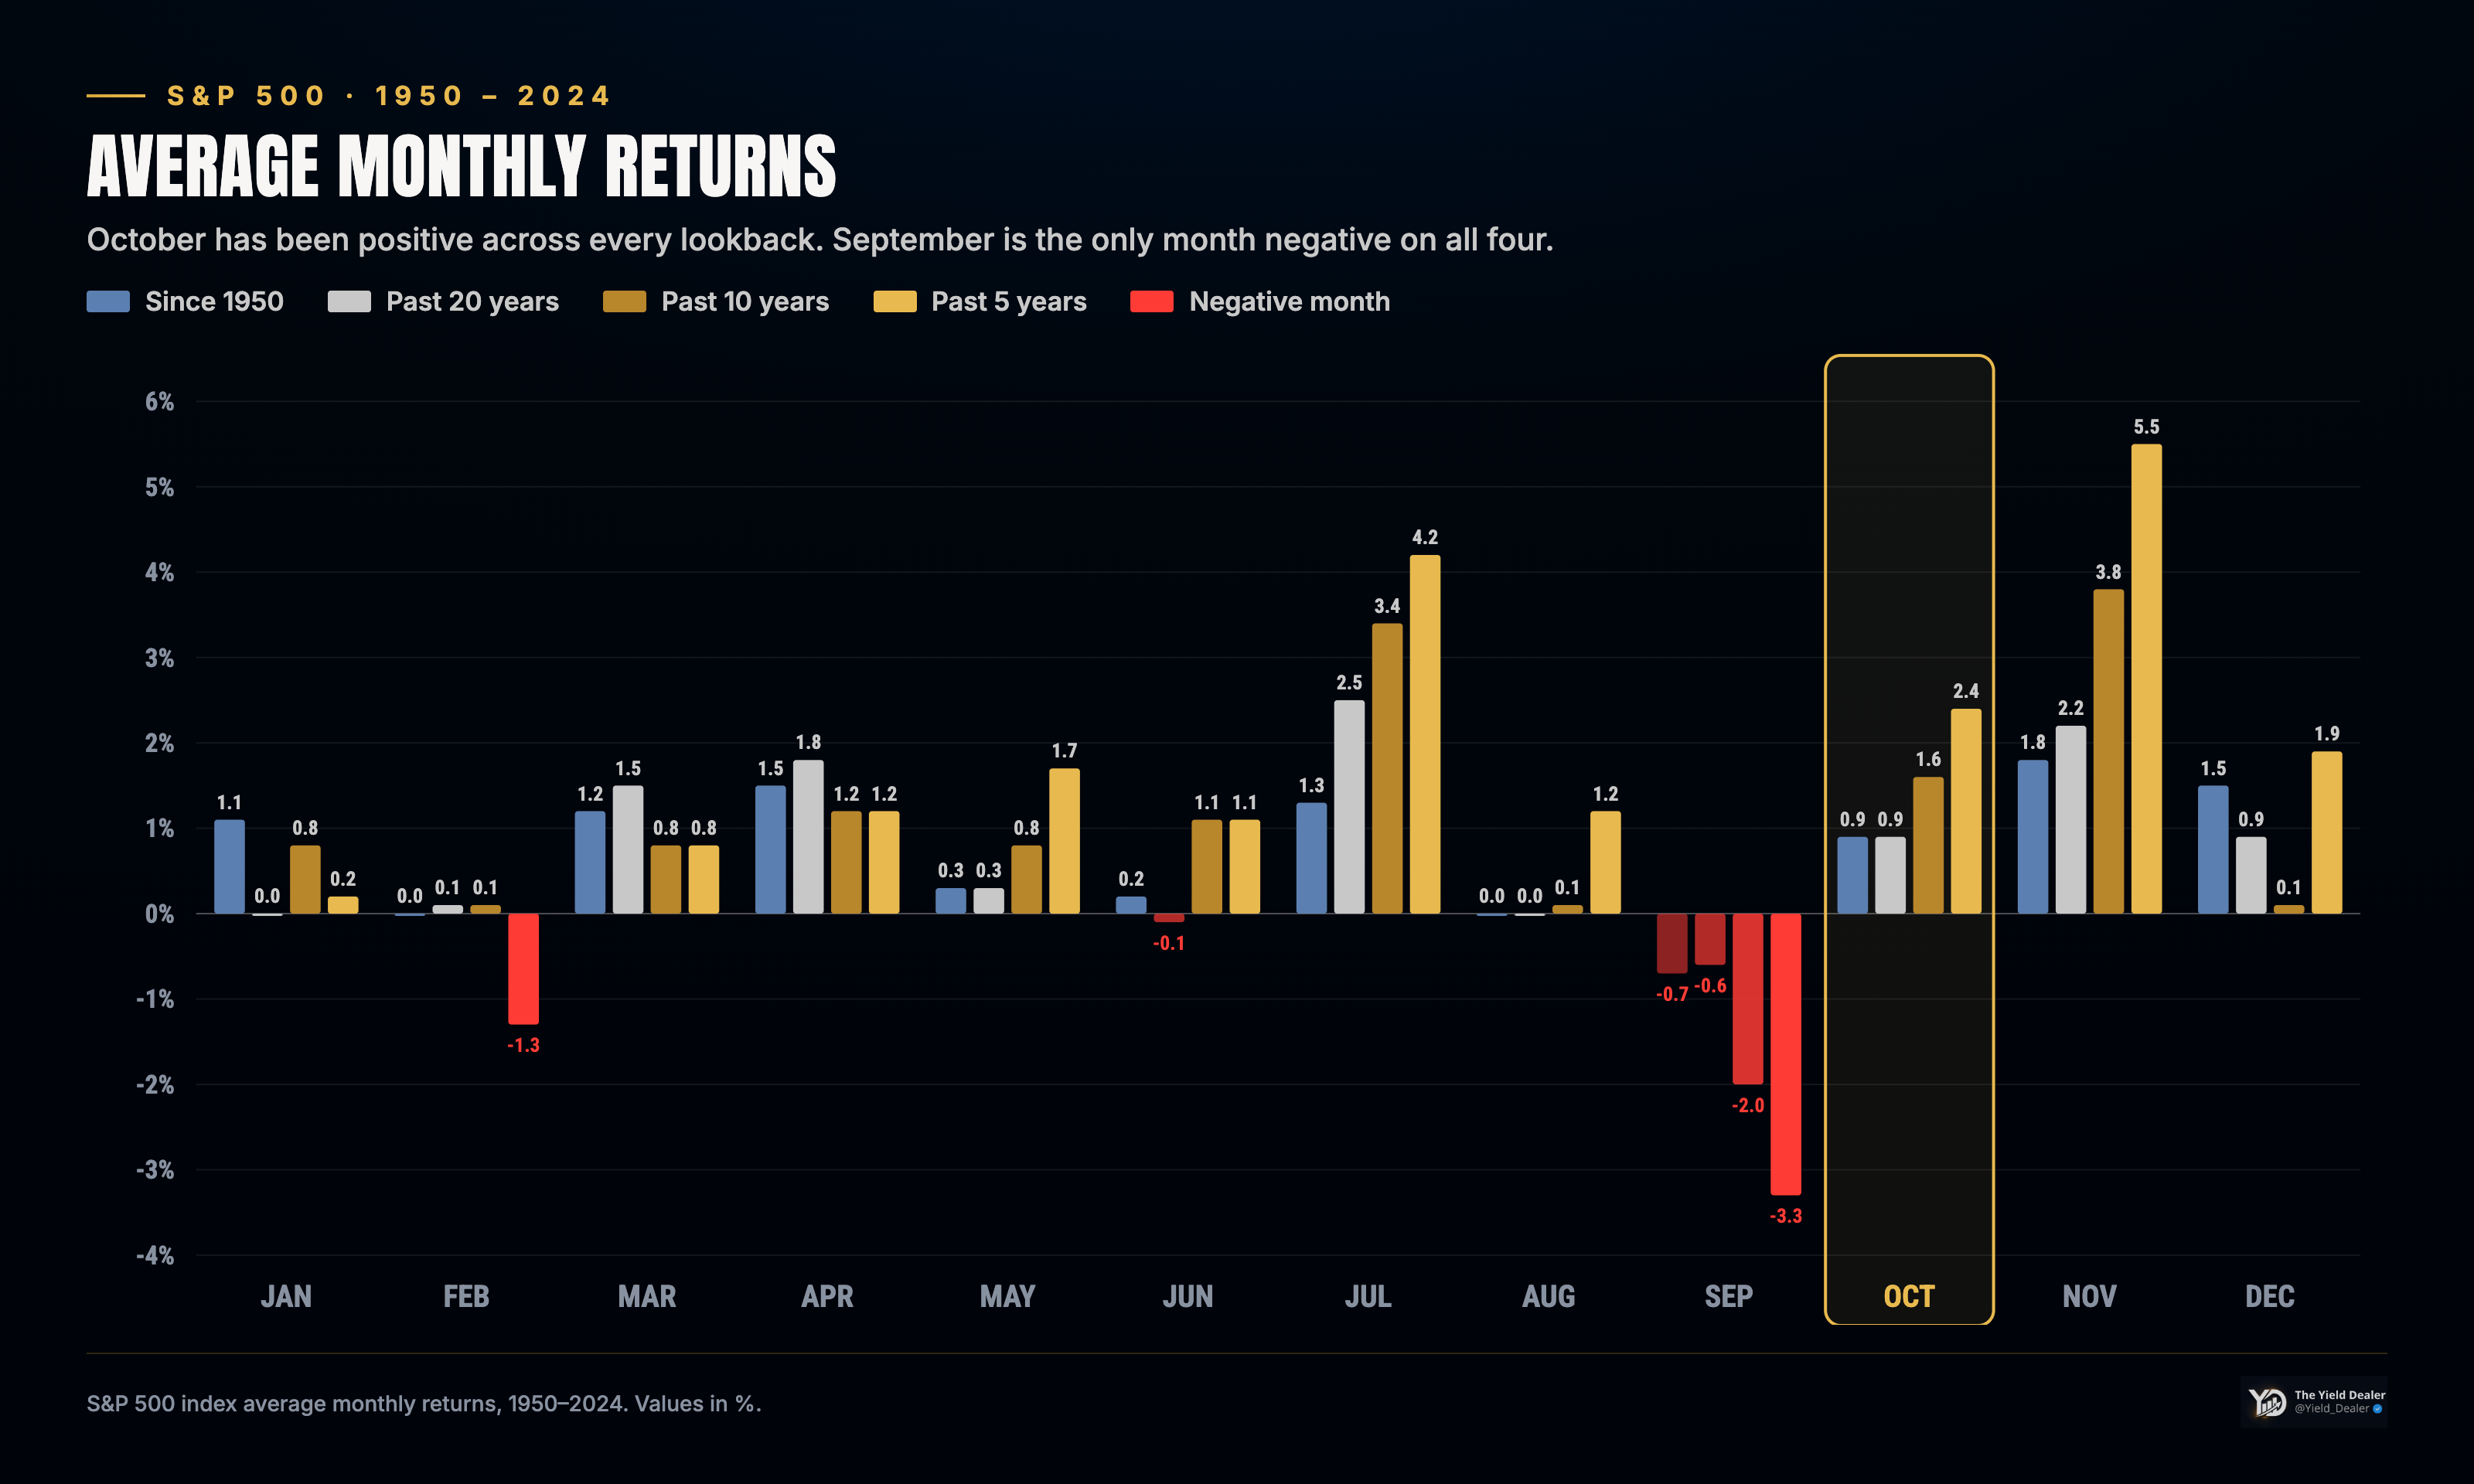
That hardly sounds like a month that’s consistently preparing for a crash.
October has actually ranked around the middle of the pack historically. More recent data tells a similar story: returns have generally been positive over long periods, but the ride has been considerably more volatile than the average return might suggest.
That distinction matters.
October isn’t necessarily a month of poor returns. It’s a month where the path can be unusually uncomfortable.
Fidelity notes that since 1945, the standard deviation of S&P 500 monthly returns in October has been about 33% higher than the average of the other eleven months.
So yes, October deserves its reputation for volatility. It just doesn’t necessarily deserve the reputation for consistently negative performance.
That’s a different story.
The first half of October can be uncomfortable
Seasonality gets more interesting when you look inside the month rather than simply at where the S&P 500 ends up on October 31.
Historical patterns compiled by Stock Trader’s Almanac show that October has often experienced weakness and choppiness during roughly the first seven or eight trading sessions before finding support and improving later in the month.
Of course, this isn’t a trading signal. There’s nothing magical about the eighth trading day.
But it does provide some useful context when markets fall early in October.
A weak first week doesn’t automatically mean something fundamental has changed. It may simply be volatility — particularly if earnings, interest rates and economic data remain broadly supportive.
That’s why I don’t want to enter October with a binary mindset of “the market will crash” or “the market will rally.”
The question I’d rather answer is:
If the market does sell off, is the fundamental picture actually getting worse?
That’s a much more useful question than trying to predict where the S&P 500 will finish on October 31.
Why October is sometimes called the “Bear Killer”
There’s an interesting contradiction in October’s reputation.
The same month associated with some of the biggest crashes in market history has also historically been an important month for market bottoms.
Stock Trader’s Almanac describes October as the “Bear Killer,” identifying 13 post-World War II bear markets or major downturns in which October played a role in turning the market higher, including 1957, 1966, 1974, 1987, 1990, 2002 and 2022.
The label shouldn’t be taken to mean that every October ends a bear market. It doesn’t.
What it does tell us is that October has historically been a month when prolonged selling has sometimes exhausted itself and markets have started looking beyond the problems that caused the decline.
That’s the irony of October.
The month investors associate with crashes has also frequently been a month of capitulation, stabilization and recovery.
For me, that’s a more useful way to think about it.
2026 is a midterm election year — but don’t overestimate the calendar
There’s another reason October 2026 deserves attention: the United States is approaching its midterm elections.
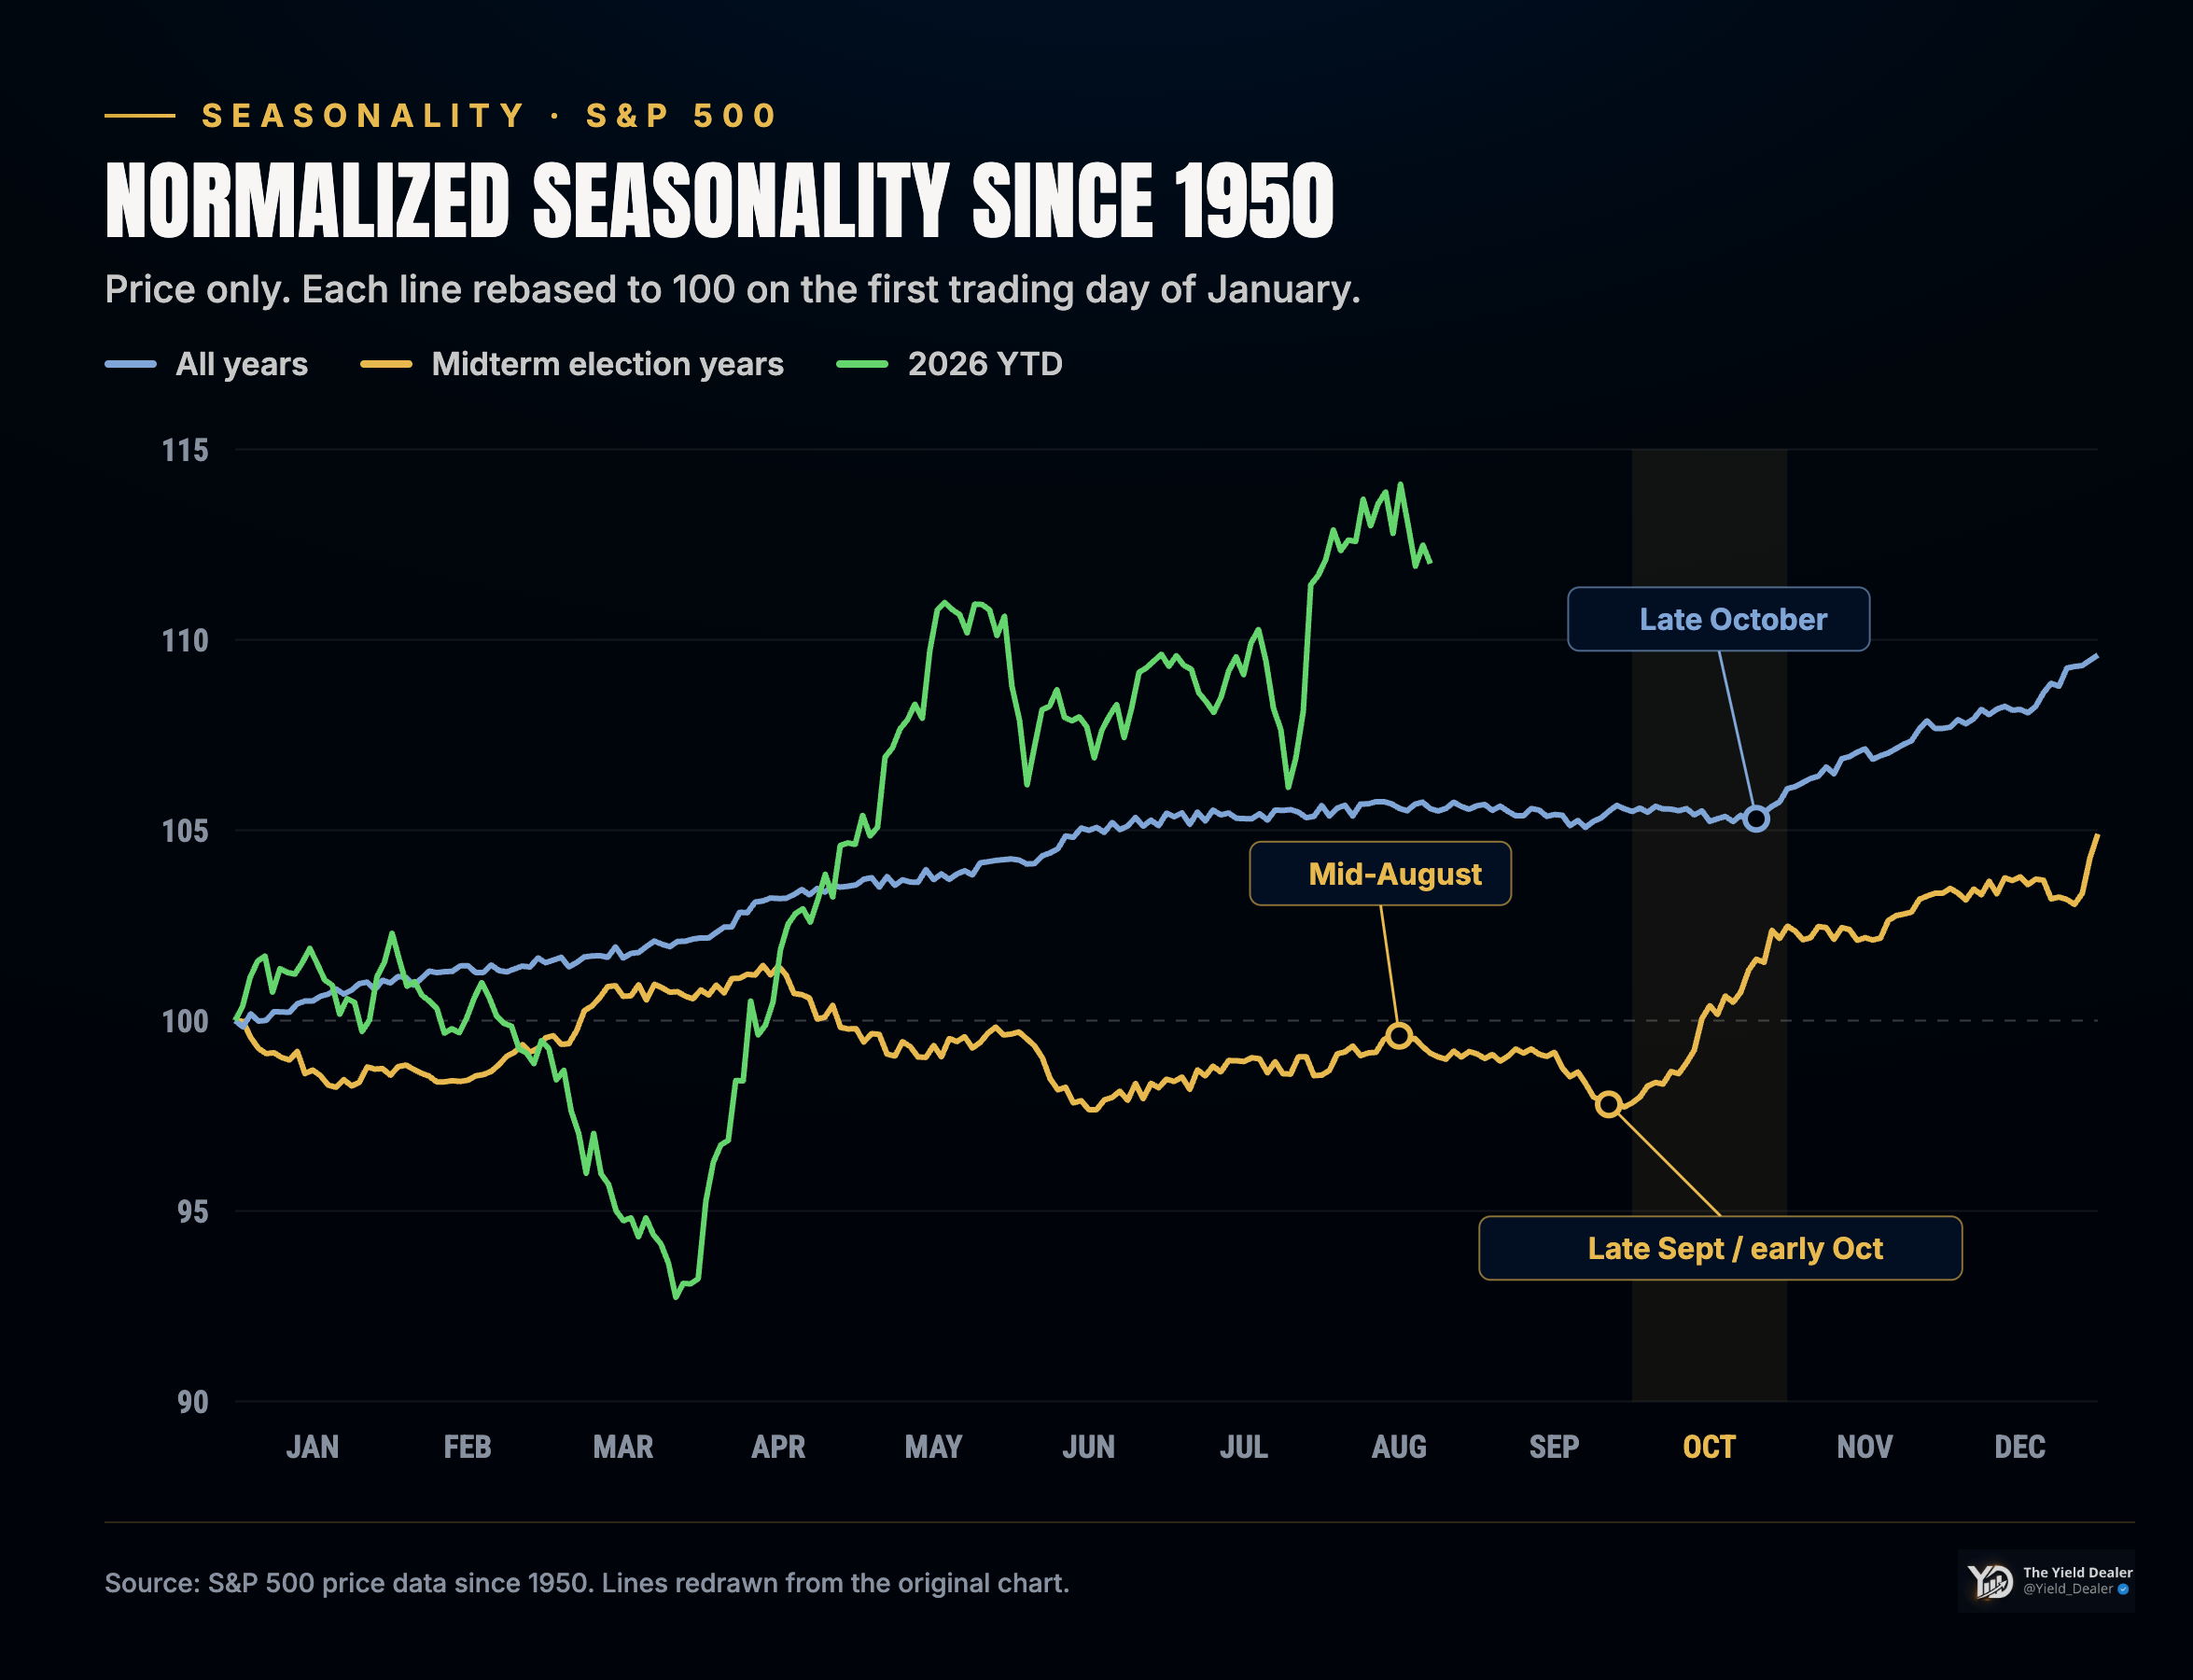
Historical data from 1950–2017 shows that October has performed differently depending on where the market sits in the four-year presidential cycle. During midterm years, the S&P 500 averaged approximately +3.3% in October, compared with +1.0% in post-election years, +0.1% in pre-election years and -0.7% in presidential election years.
The pattern is even stronger across some other major indexes, with historical midterm October averages of approximately +4.2% for the Nasdaq and +3.9% for the Russell 2000.
Those numbers are interesting. I just wouldn’t turn them into a 2026 forecast.
Seasonality tells us what has happened before. It doesn’t tell us what has to happen next.
Fidelity’s current research on the 2026 midterms makes a similar point: historical midterm patterns exist, but corporate earnings, business investment and economic conditions have historically been more important drivers of long-term market returns than the election itself.
That’s particularly important this year because 2026 has already deviated from several historical patterns.
Markets don’t know they’re supposed to follow an election-cycle chart.
The more interesting statistic comes after October
There’s one piece of seasonality I find particularly interesting.
Since 1957, the S&P 500 has finished the year above its October low in approximately 93% of years, according to data cited by MarketWatch’s Mark Hulbert. The average gain from that October low through December 31 was approximately 7.4%.
There’s an important detail here: the 7.4% is measured from the lowest point reached during October, not from October 1.
That completely changes how I look at the statistic.
It doesn’t mean that buying the S&P 500 on October 1 historically produced a 7.4% return by year-end. It means that once an October low was established, the market historically finished the year higher than that low in the vast majority of years.
That’s much more useful.
It suggests that October’s volatility can sometimes be the beginning of the move rather than the end of it.
The real seasonal opportunity is November through April
October also sits at an interesting point in the market calendar.
The historically weaker May-through-October period is coming to an end, while November through April has historically been the stronger six-month period for U.S. equities.
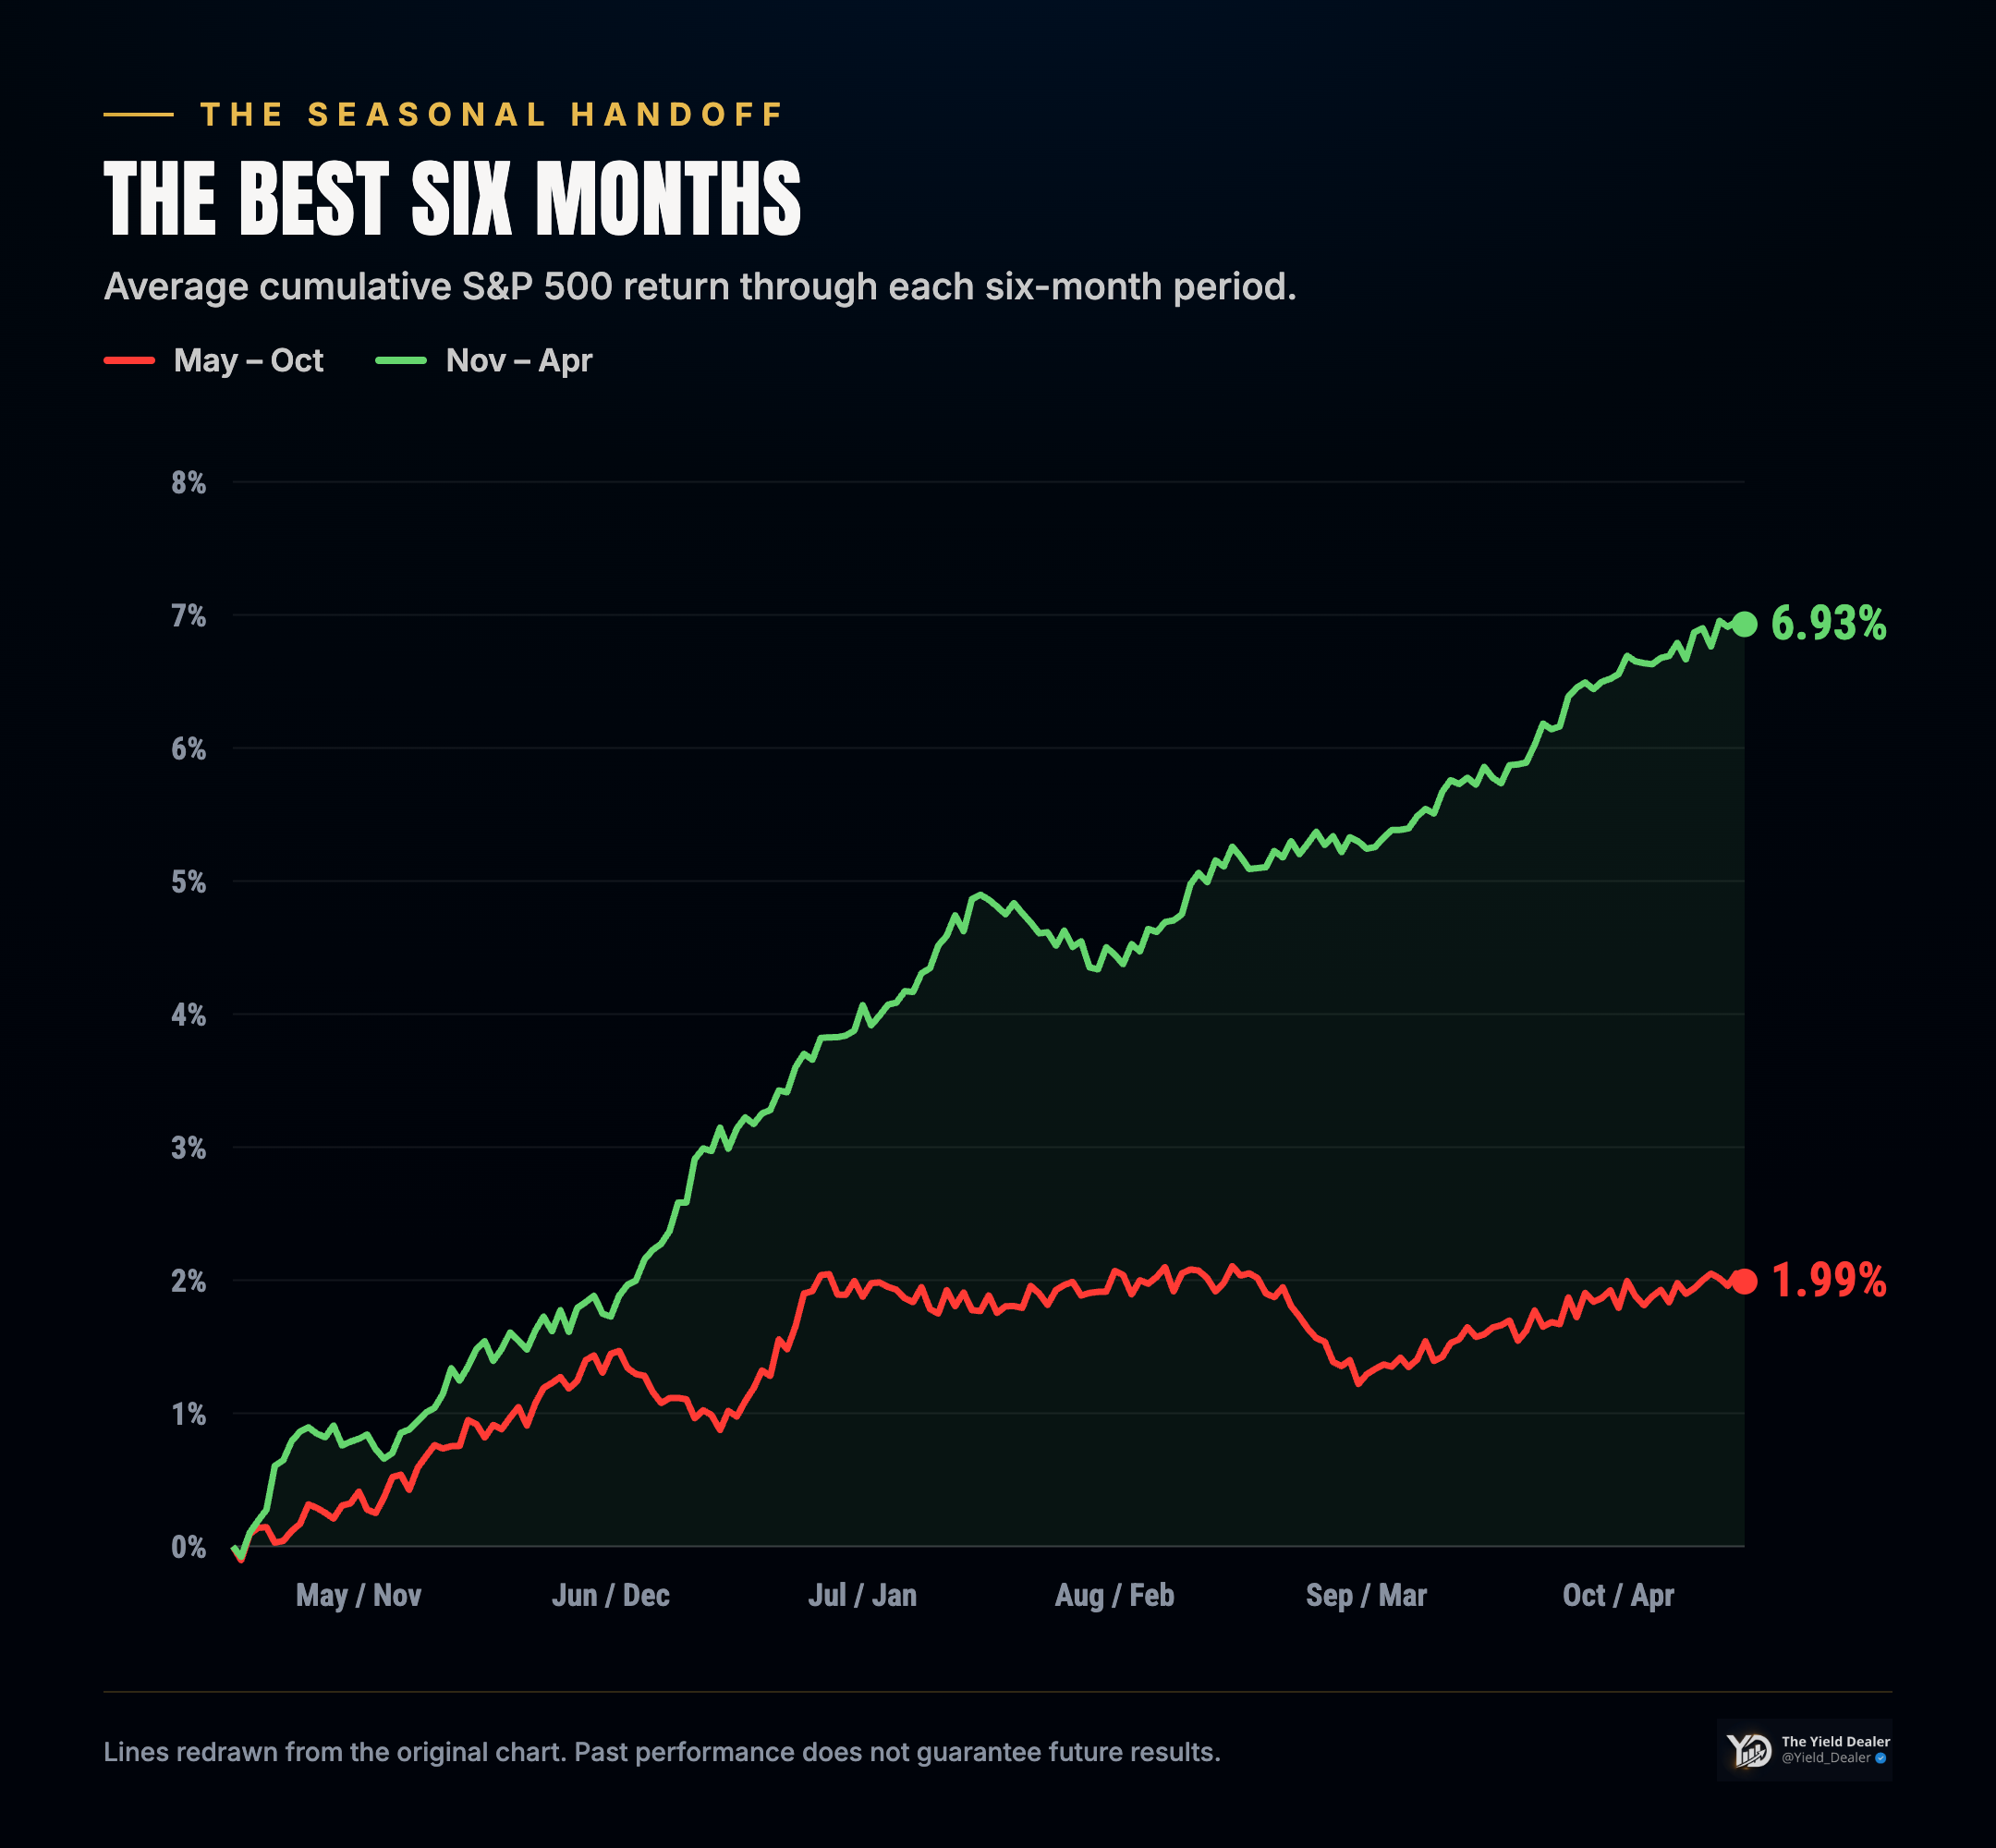
Fidelity’s analysis of the “best six months” phenomenon identifies November through April as the strongest six-month period historically.
That doesn’t mean you should sell in May and automatically buy back in November. Doing that introduces timing risk, taxes and the possibility of missing some of the market’s strongest days.
The more useful takeaway is simple:
If October brings a meaningful correction, November and December are historically entering a more favorable seasonal window.
And that’s where valuation becomes important.
If the market falls because investors become excessively pessimistic while earnings expectations remain intact, long-term investors may find better opportunities.
If it falls because earnings estimates are collapsing, credit conditions are deteriorating and economic growth is rolling over, the same decline deserves a very different interpretation.
The price chart alone can’t tell you which one you’re looking at.
What actually matters this October
So what am I actually watching in October?
For me, it comes down to interest rates, Treasury yields, inflation, oil prices, corporate earnings and economic growth.
Those are the things that ultimately determine whether current valuations can hold.
Higher Treasury yields can put pressure on equity valuations. Persistent inflation can limit the Federal Reserve’s ability to ease monetary policy. Higher oil prices can squeeze consumers and corporate margins. Weak earnings can undermine even valuations that initially look attractive.
And the opposite is true as well.
If inflation continues to moderate, rates become less restrictive, earnings remain strong and economic growth holds up, an October sell-off could turn out to be little more than a temporary reset in valuations.
That’s why I don’t want to build an October strategy around the calendar.
How I’m approaching October
For me, October isn’t a month to become more bearish simply because the calendar says so.
It’s a month to become more selective.
If quality companies I already want to own become cheaper, I want to have the liquidity and conviction to take advantage of it. That’s how I approached McDonald’s last month. I didn’t buy simply because MCD had fallen. I bought because MCD eventually reached a price where I felt the valuation made sense relative to the business, cash flow, dividend and long-term thesis.
I want to apply the same principle to the broader market.
I’m not trying to predict the October low. Nobody knows when it will happen — or whether there will even be one that matters.
Instead, I want to know what I’m willing to buy if the market gives me better prices.
That’s a much more useful question for a long-term investor.
October is not the enemy
The biggest lesson I take from October’s history isn’t that the month is bullish or bearish.
It’s that investor perception and market reality can be very different things.
Yes, some of the most dramatic crashes in history happened in October. But the broader data doesn’t show that October is inherently a month of market collapse. It shows a month with unusually high volatility, frequent turning points and a position immediately before the historically stronger November-to-April period.
And in 2026, the midterm election cycle adds another layer of uncertainty — but not a reason to make portfolio decisions based on political headlines.
For me, the framework is simple: watch the fundamentals, respect valuation, keep some liquidity available, and use volatility to reassess the prices you’re willing to pay.
If October brings a correction, I won’t automatically see danger.
I’ll be asking a different question:
Did the value of the businesses I want to own actually fall — or did their stock prices simply fall?
That’s where the real opportunity can begin.


Want to get The Yield Dealer’s Newsletter in your inbox? Join other readers here.
Want short ideas on living and working on your own terms? Follow me on X/Twitter and Instagram.