


The P/E ratio is the best-known valuation metric in investing. But it has one major blind spot: it says nothing about how fast a company is actually growing. That’s where the PEG ratio (Price/Earnings to Growth) comes in — it sharpens your analysis by folding growth into the equation.
What is the PEG ratio?
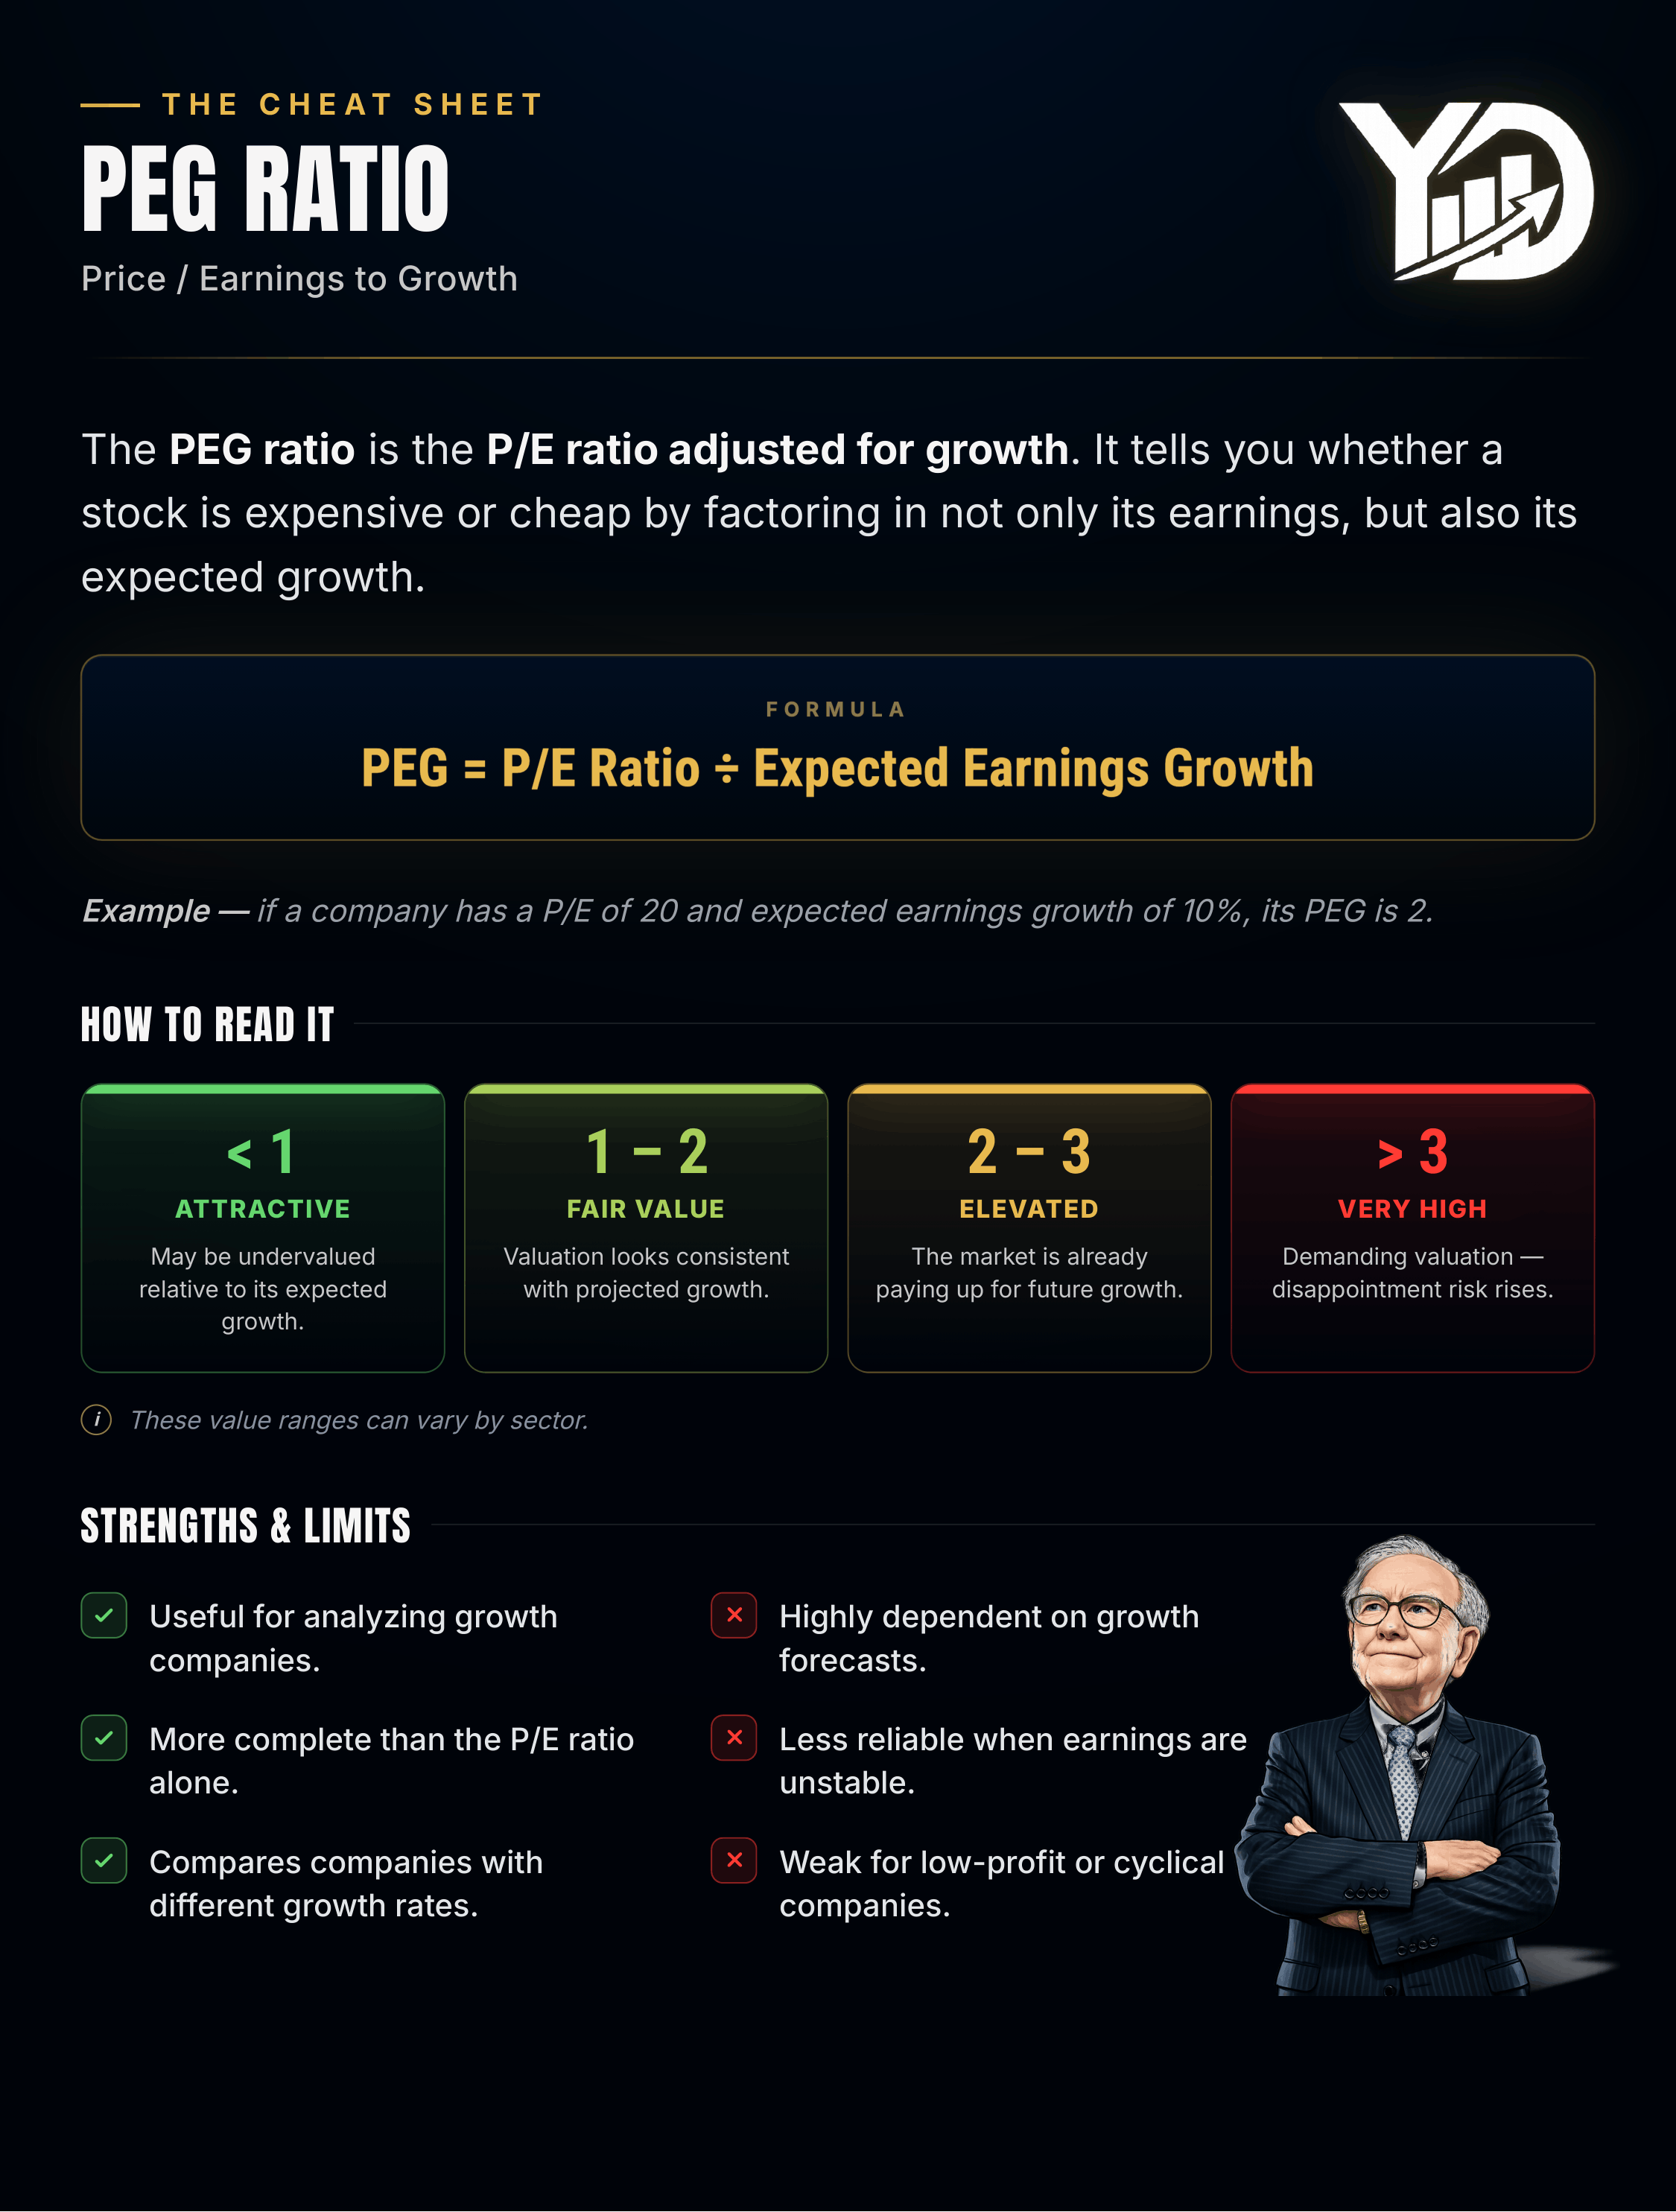
The PEG ratio compares a stock’s P/E to its expected earnings growth rate. It was popularized by legendary investor Peter Lynch, manager of the Fidelity Magellan Fund, who wanted a simple way to spot undervalued growth stocks.
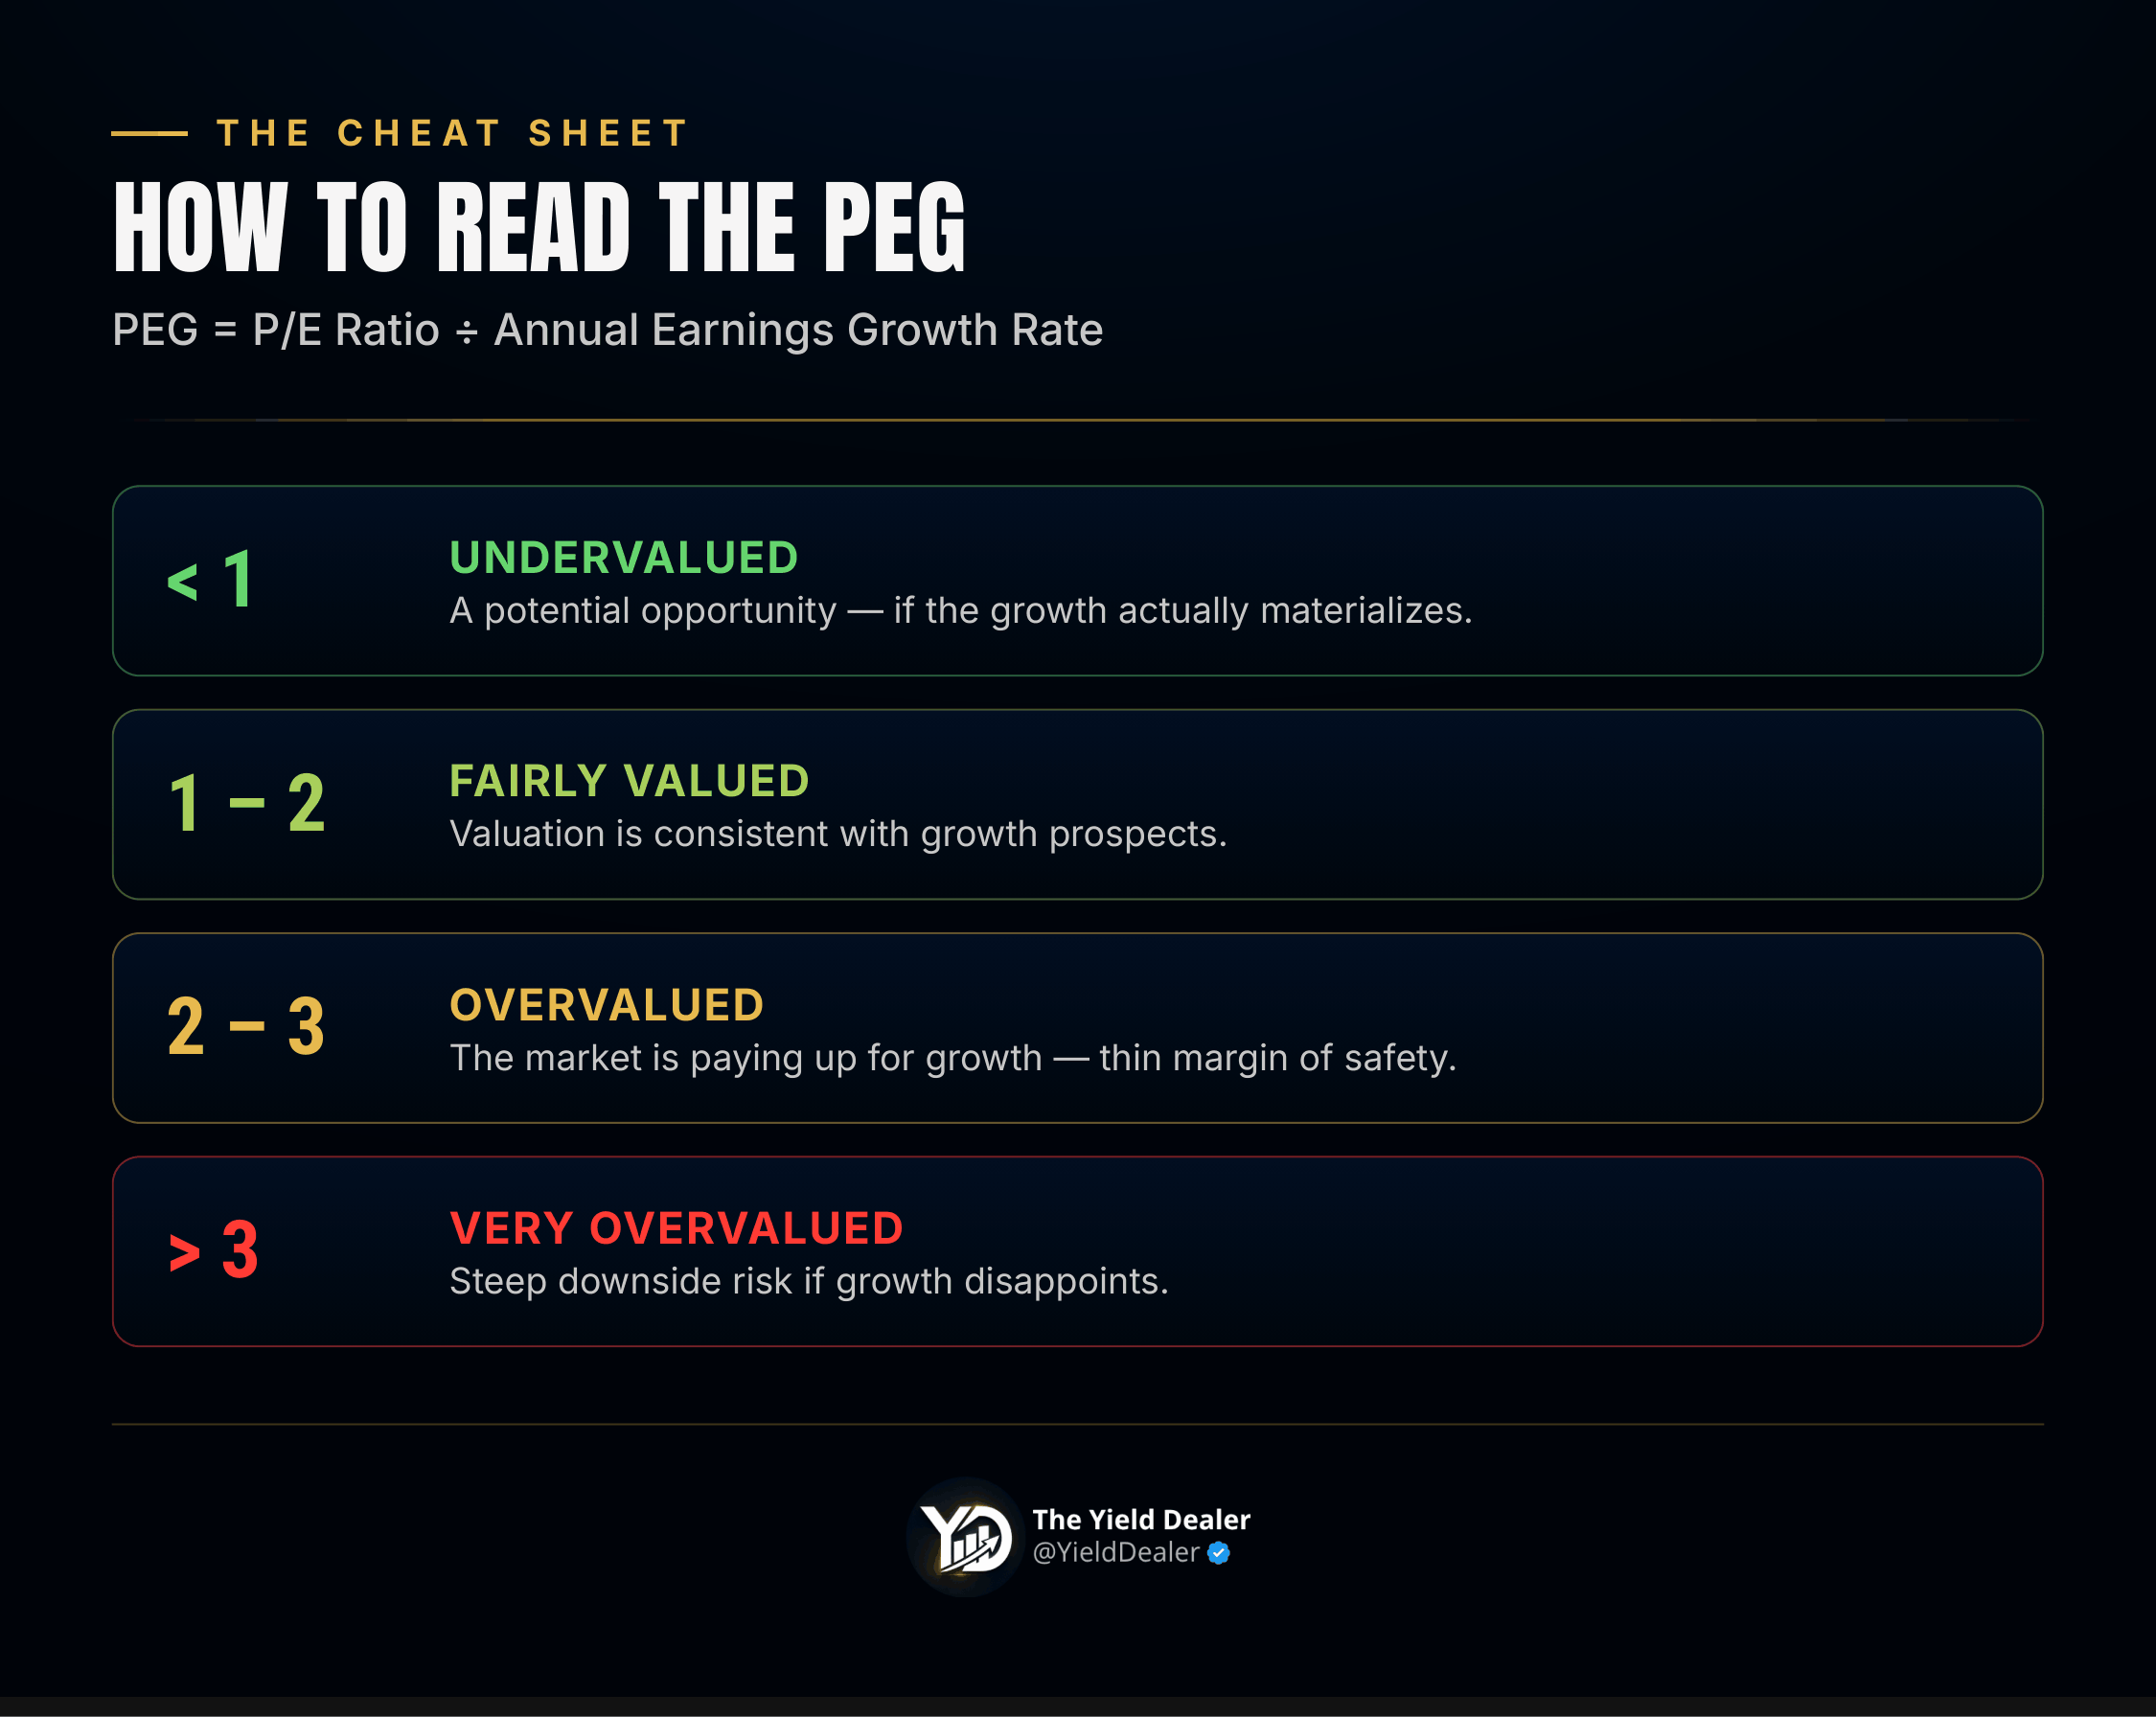
Formula: PEG = P/E Ratio ÷ Annual Earnings Growth Rate (%)
Example: A company has a P/E of 20 and expected annual earnings growth of 25%. PEG = 20 ÷ 25 = 0.8
A PEG below 1 suggests the stock could be undervalued — even with a relatively high P/E.
Why the PEG ratio matters
1. It puts the P/E in context. A P/E of 30 looks steep on its own. But if that company is growing earnings 40% a year, its PEG is 0.75 — a potential opportunity. Meanwhile a “reasonable” P/E of 15 with only 5% growth gives a PEG of 3 — a warning sign of overvaluation.
2. It lets you compare across sectors. Tech companies naturally carry higher P/Es than traditional industries. PEG lets you compare a fast-growing tech name against a mature industrial company on more equal footing.
3. It flags two classic mistakes. Buying a “value trap” — a stock that looks cheap (low P/E) but has no real growth ahead. And overpaying for a “growth” stock the market has already priced to perfection.
How to calculate and read it 📊
Step 1 — Get the P/E. Available on any financial data platform, or calculate it yourself.
Step 2 — Determine the growth rate. This is the tricky part. Options include: historical growth (average EPS growth over the last 3–5 years), forward growth (analyst consensus for the next 3–5 years), or a blended approach. Favor 3–5 year windows to smooth out yearly noise. For large, heavily-covered U.S. companies, forward growth estimates tend to be more reliable.
Step 3 — Interpret the result:
Below 1 — Potentially undervalued, if that growth actually materializes.
1 – 2 — Fairly valued, consistent with growth prospects.
2 – 3 — Overvalued — the market is paying up for growth, with a thin margin of safety.
Above 3 — Significantly overvalued — steep downside risk if growth disappoints.
Worked examples
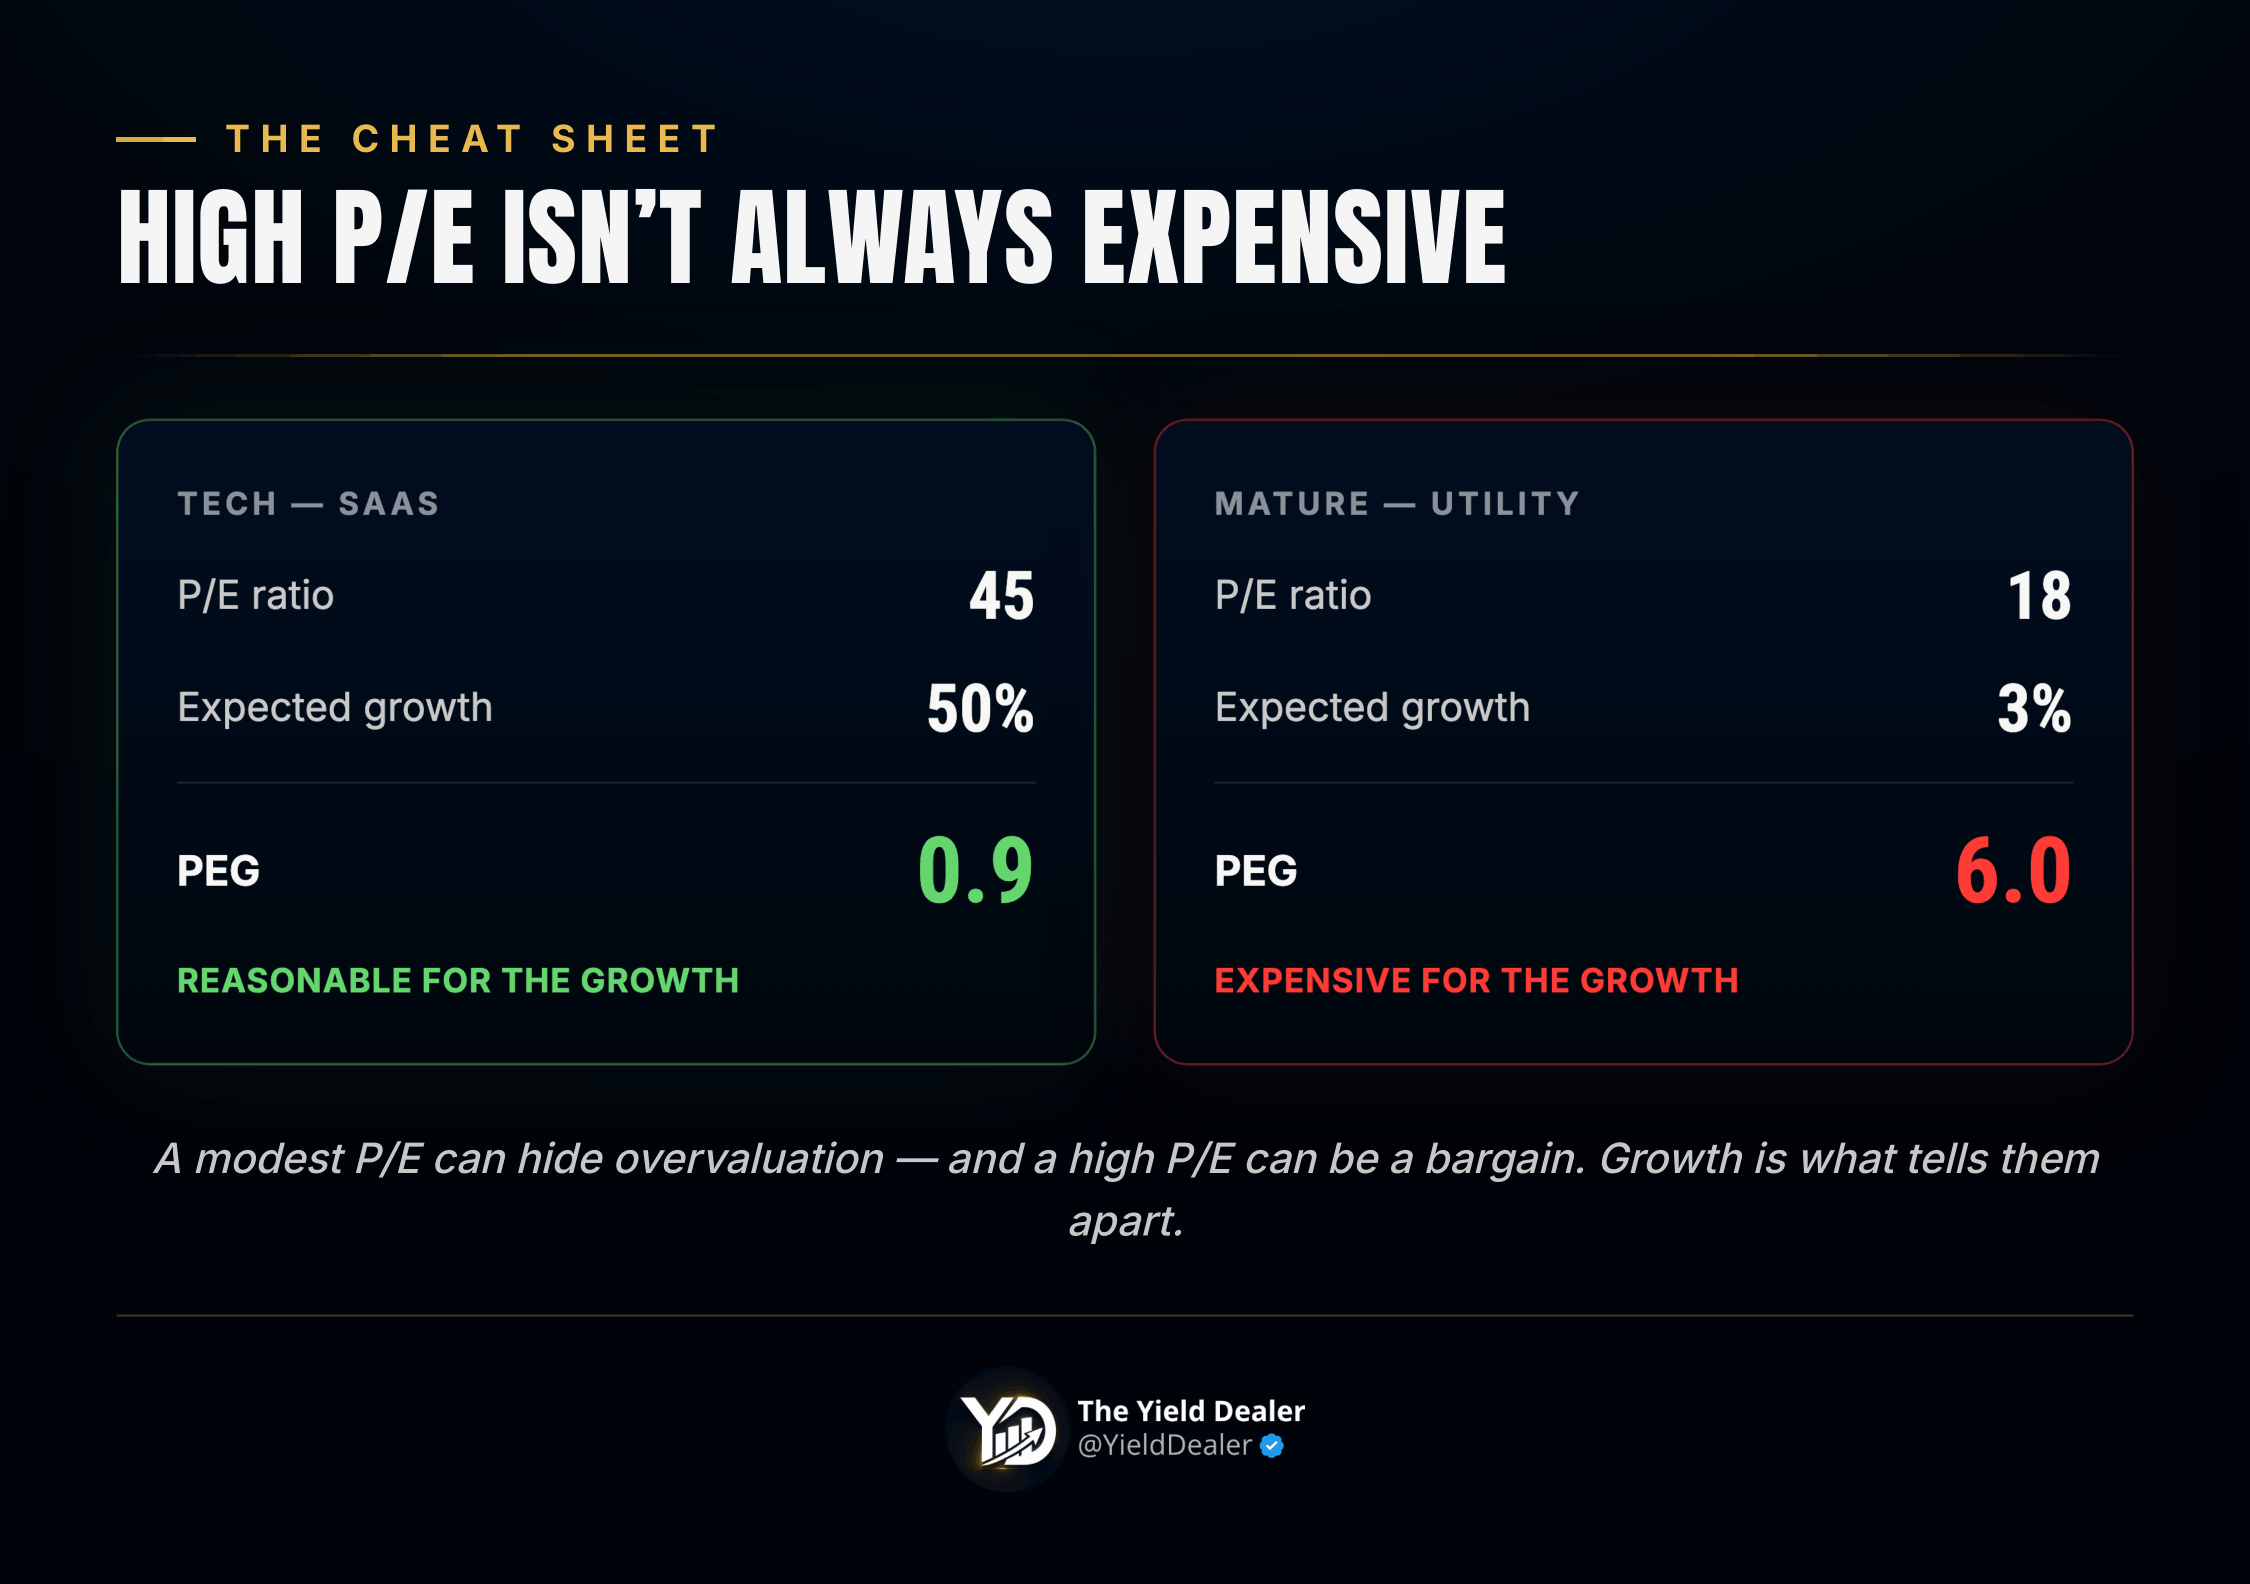
A tech name: P/E of 45, expected growth of 50%/year → PEG = 0.9. Despite the high P/E, the valuation looks reasonable given the growth on offer — potentially attractive to a growth investor.
A mature utility: P/E of 18, expected growth of just 3%/year → PEG = 6. Even a modest P/E can hide serious overvaluation once growth is this thin.
Where the PEG ratio falls short
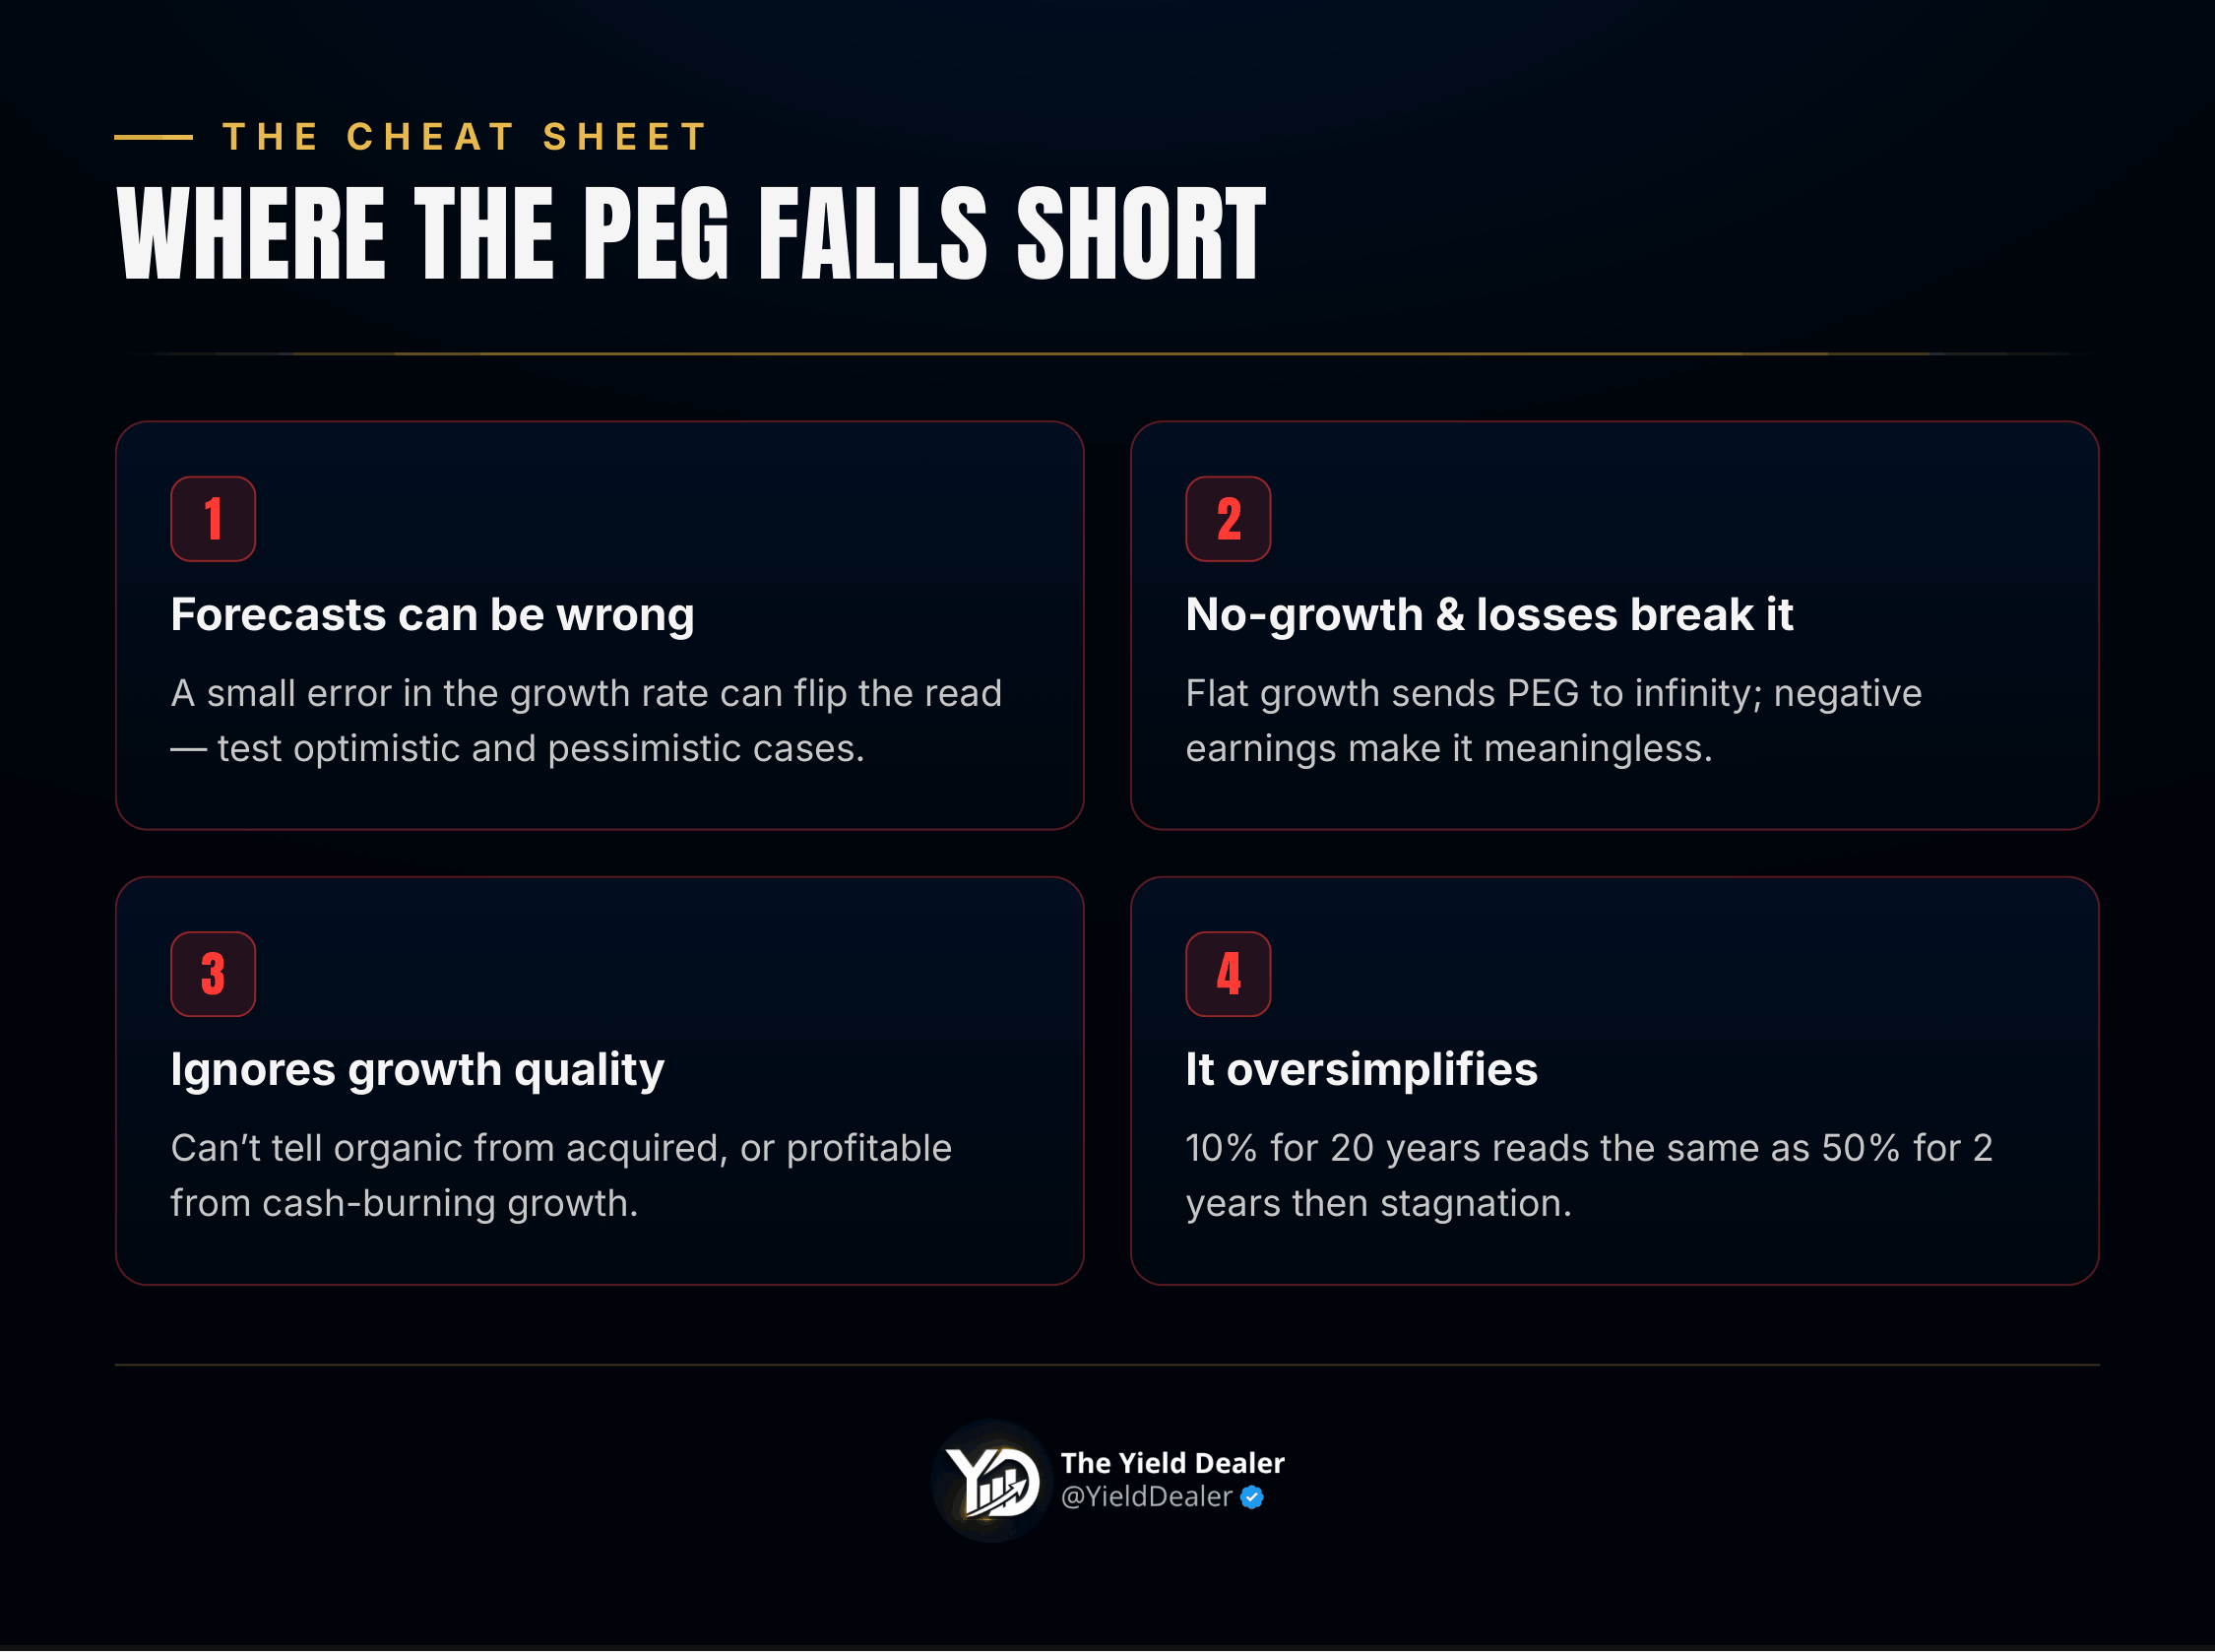
❌ It depends on growth forecasts — which are just estimates. A small error in the growth number can flip the entire read. Fix: run optimistic, realistic, and pessimistic scenarios and test how sensitive the PEG is.
❌ It doesn’t work for no-growth or unprofitable companies. Near-zero growth pushes PEG toward infinity; negative earnings make P/E (and PEG) meaningless; cyclical businesses swing too much year to year. PEG is best reserved for steady, profitable growers.
❌ It ignores the quality of growth. PEG can’t tell organic growth from growth bought via acquisitions, profitable growth from cash-burning growth, or durable growth from a temporary spike. Fix: pair it with ROE, free cash flow trends, and operating margin.
❌ It oversimplifies. PEG treats 10% growth sustained for 20 years the same as 50% growth for 2 years followed by stagnation. Fix: assess how durable the business model really is, and how large the addressable market is.
PEG by investing style
Growth investors — PEG is your best friend: it flags growth stocks that are still reasonably priced and helps you avoid overpaying even for excellent businesses. Peter Lynch’s rule of thumb: look for PEG below 1 with growth above 20%.
Value investors — PEG can expose value traps. A stock with a P/E of 8 isn’t automatically cheap if growth is flat or negative. Tip: pair PEG with the Price/Book ratio for a fuller value picture.
GARP investors (Growth At a Reasonable Price) — This is PEG’s ideal use case: substantial growth (15–25%+), a PEG between 0.7 and 1.5, and solid fundamentals (ROE above 15%, manageable debt).
⚠️ Common mistakes to avoid
⚠️ Trusting PEG blindly. A PEG of 0.5 isn’t automatically a bargain — dig into why the market is pricing it that low.
⚠️ Using unrealistic growth assumptions. Stay conservative; a pleasant surprise beats a letdown.
⚠️ Ignoring sector context. A PEG of 1.5 can be attractive in tech but expensive in heavy industry.
⚠️ Overlooking business quality. A great PEG doesn’t offset a fragile business model or weak competitive position.
⚠️ Forgetting the economic cycle. PEGs fall in expansions (growth is strong) and spike in recessions — adjust your read for the macro backdrop.
Where PEG works best — and where it doesn’t
Well-suited: technology (SaaS, semiconductors, e-commerce), profitable biotech and medtech, internationally-expanding consumer brands, online education and entertainment.
Less relevant: financials (cyclical growth), commodities (price-dependent), utilities (low, predictable growth), real estate (better valued on net asset value).
The bottom line
The PEG ratio is a powerful addition to your valuation toolkit — it brings in the growth dimension the P/E ignores on its own. A PEG below 1 usually signals an opportunity, but always ask why. The reliability of the ratio lives and dies with the quality of the growth estimate behind it, and it works best on steady, profitable growers. Pair it with ROE, free cash flow, debt, and operating margin — and always read it in its sector context.
PEG doesn’t replace full fundamental analysis, but it’s an excellent starting point for spotting stocks worth a closer look.


Want to get The Yield Dealer’s Newsletter in your inbox? Join other readers here.
Want short ideas on living and working on your own terms? Follow me on X/Twitter and Instagram.