

When you buy a stock, you’re buying a piece of a real business — its factories, its cash, its brands, its equipment. The Price-to-Book ratio (P/B) asks a deceptively simple question: how much am I paying for each dollar of what the company actually owns on paper?
It’s one of the oldest ratios in investing — a favorite of Benjamin Graham and the value-investing tradition that shaped Warren Buffett. But it’s also one of the most misunderstood, because “book value” means far less today than it did fifty years ago. Used well, P/B is powerful. Used blindly, it will walk you straight into value traps.
The formula
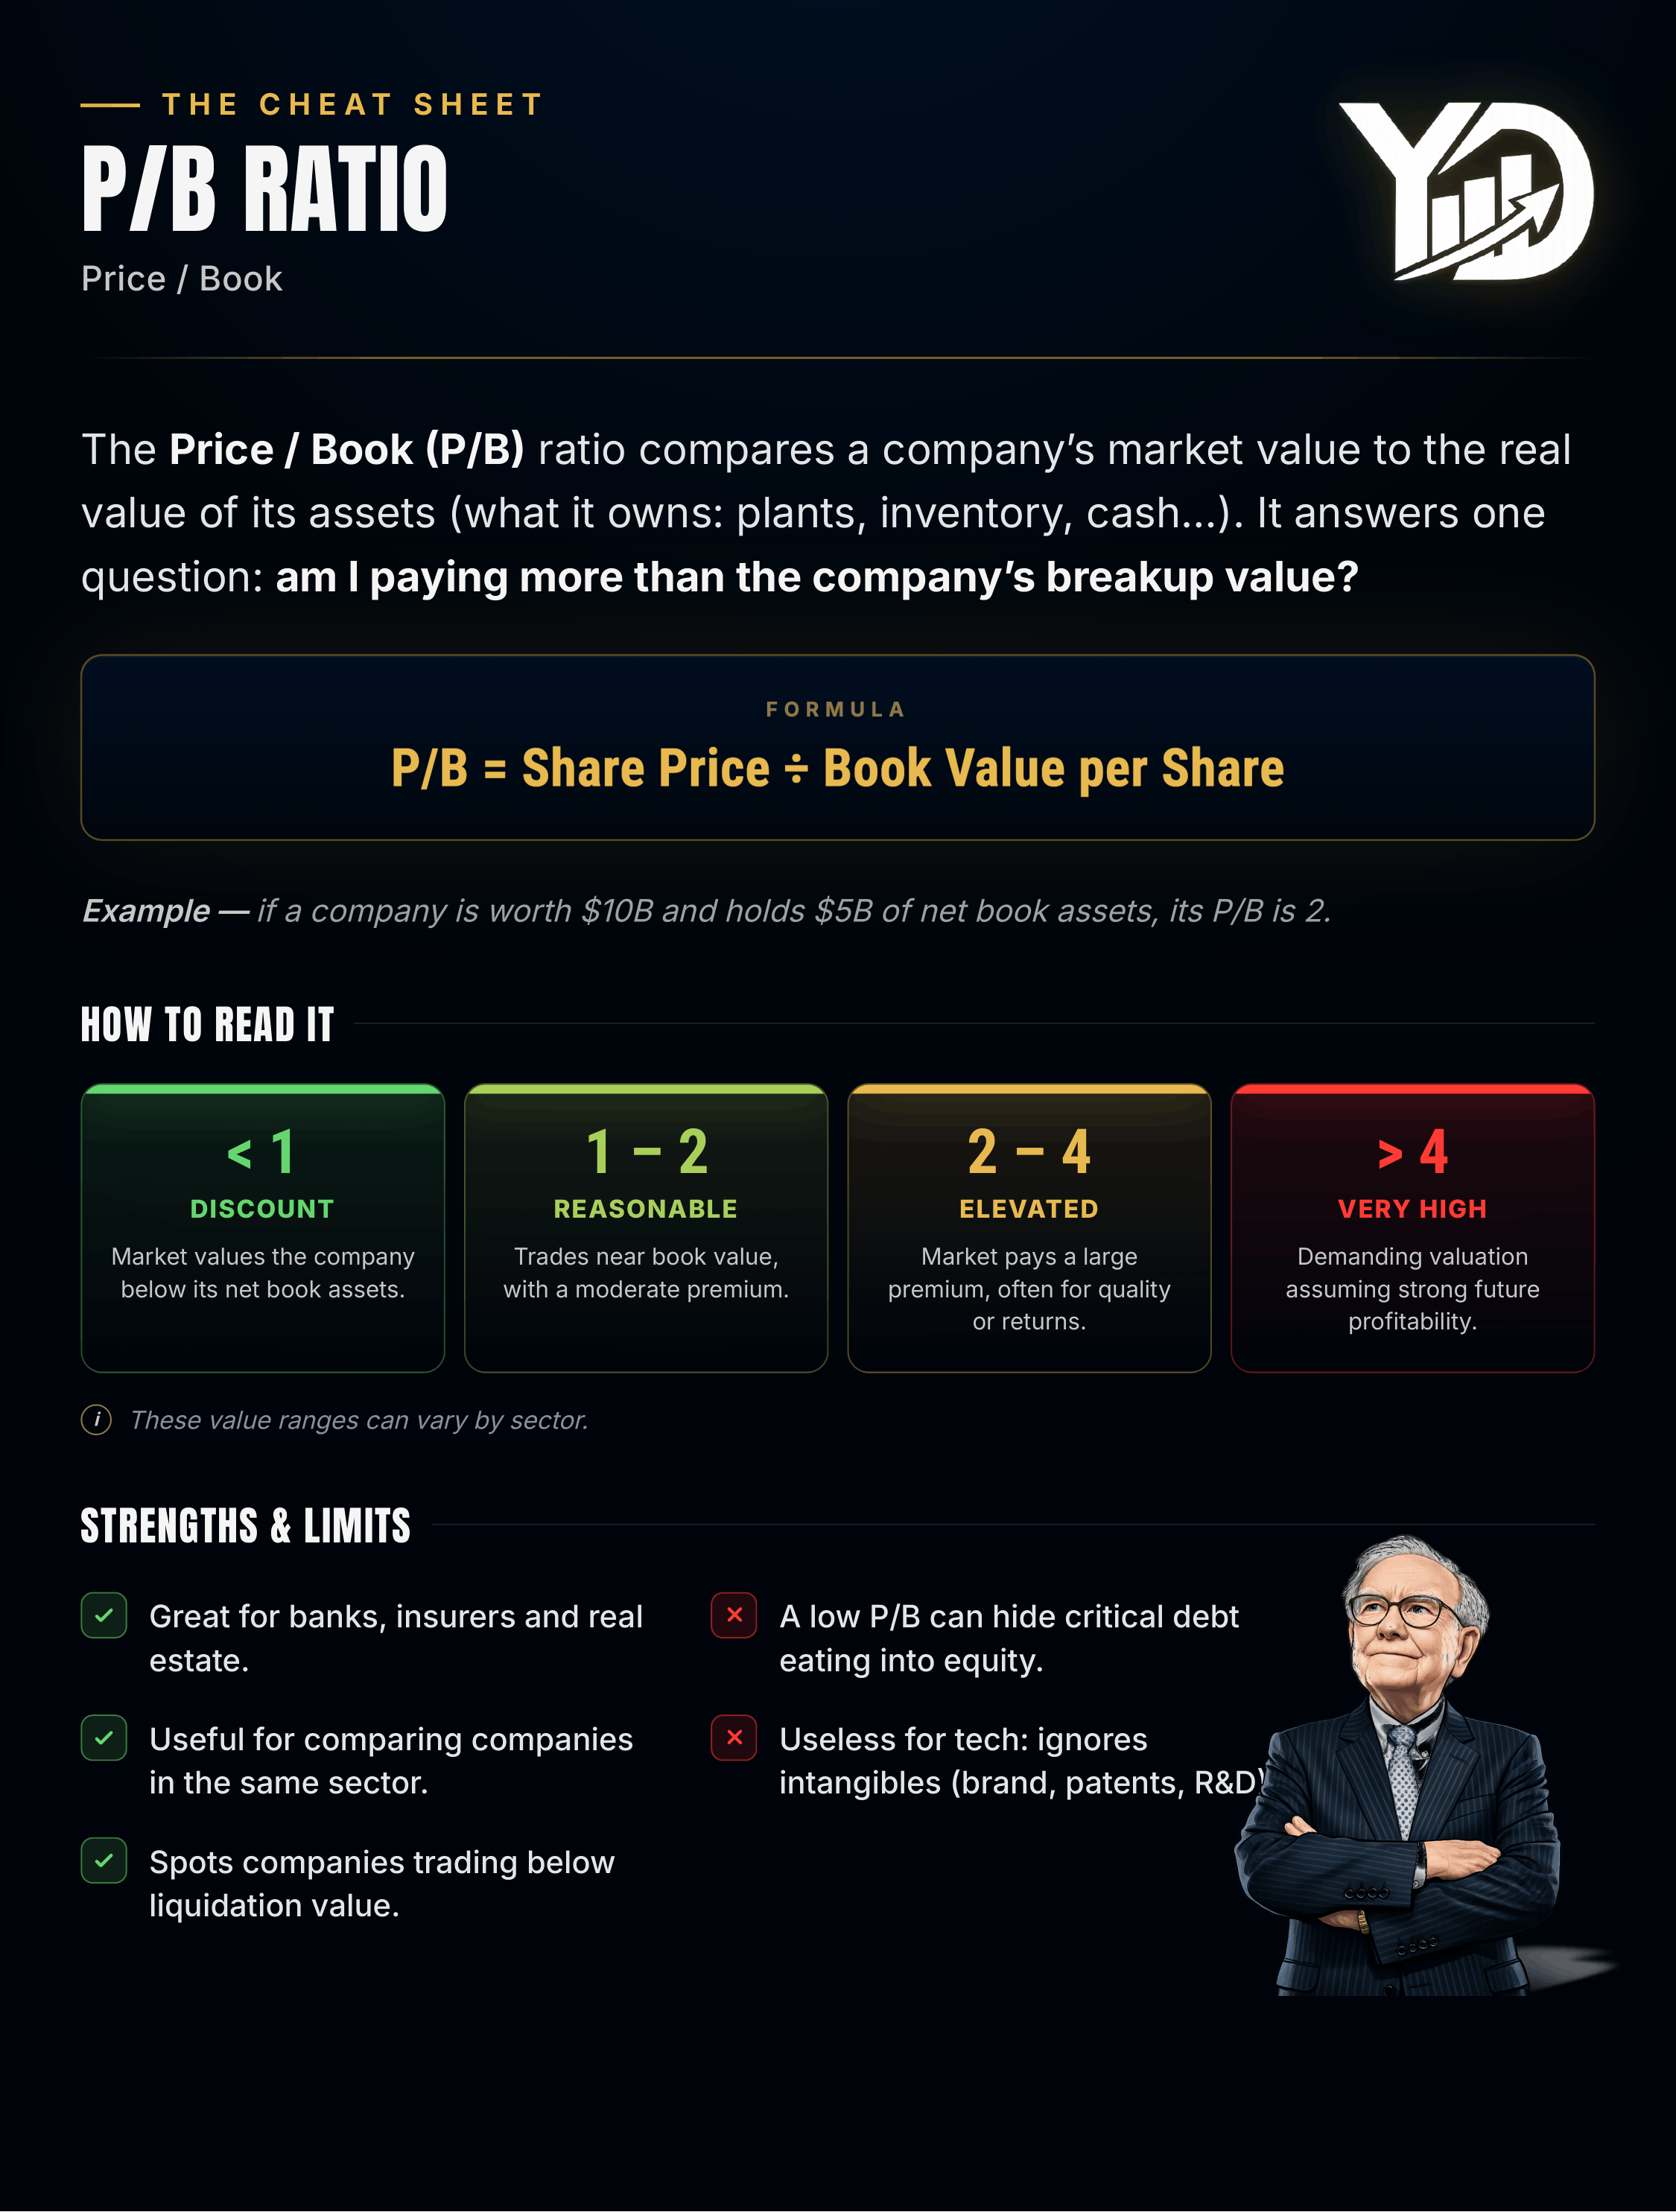
P/B = Market Cap ÷ Book Value of Equity
Or, on a per-share basis:
P/B = Share Price ÷ Book Value per Share
Book value is simply what’s left for shareholders on the balance sheet: total assets minus total liabilities. It’s the accounting value of the company’s equity — roughly, what would theoretically remain for shareholders if the company sold everything at its recorded value and paid off all its debts.
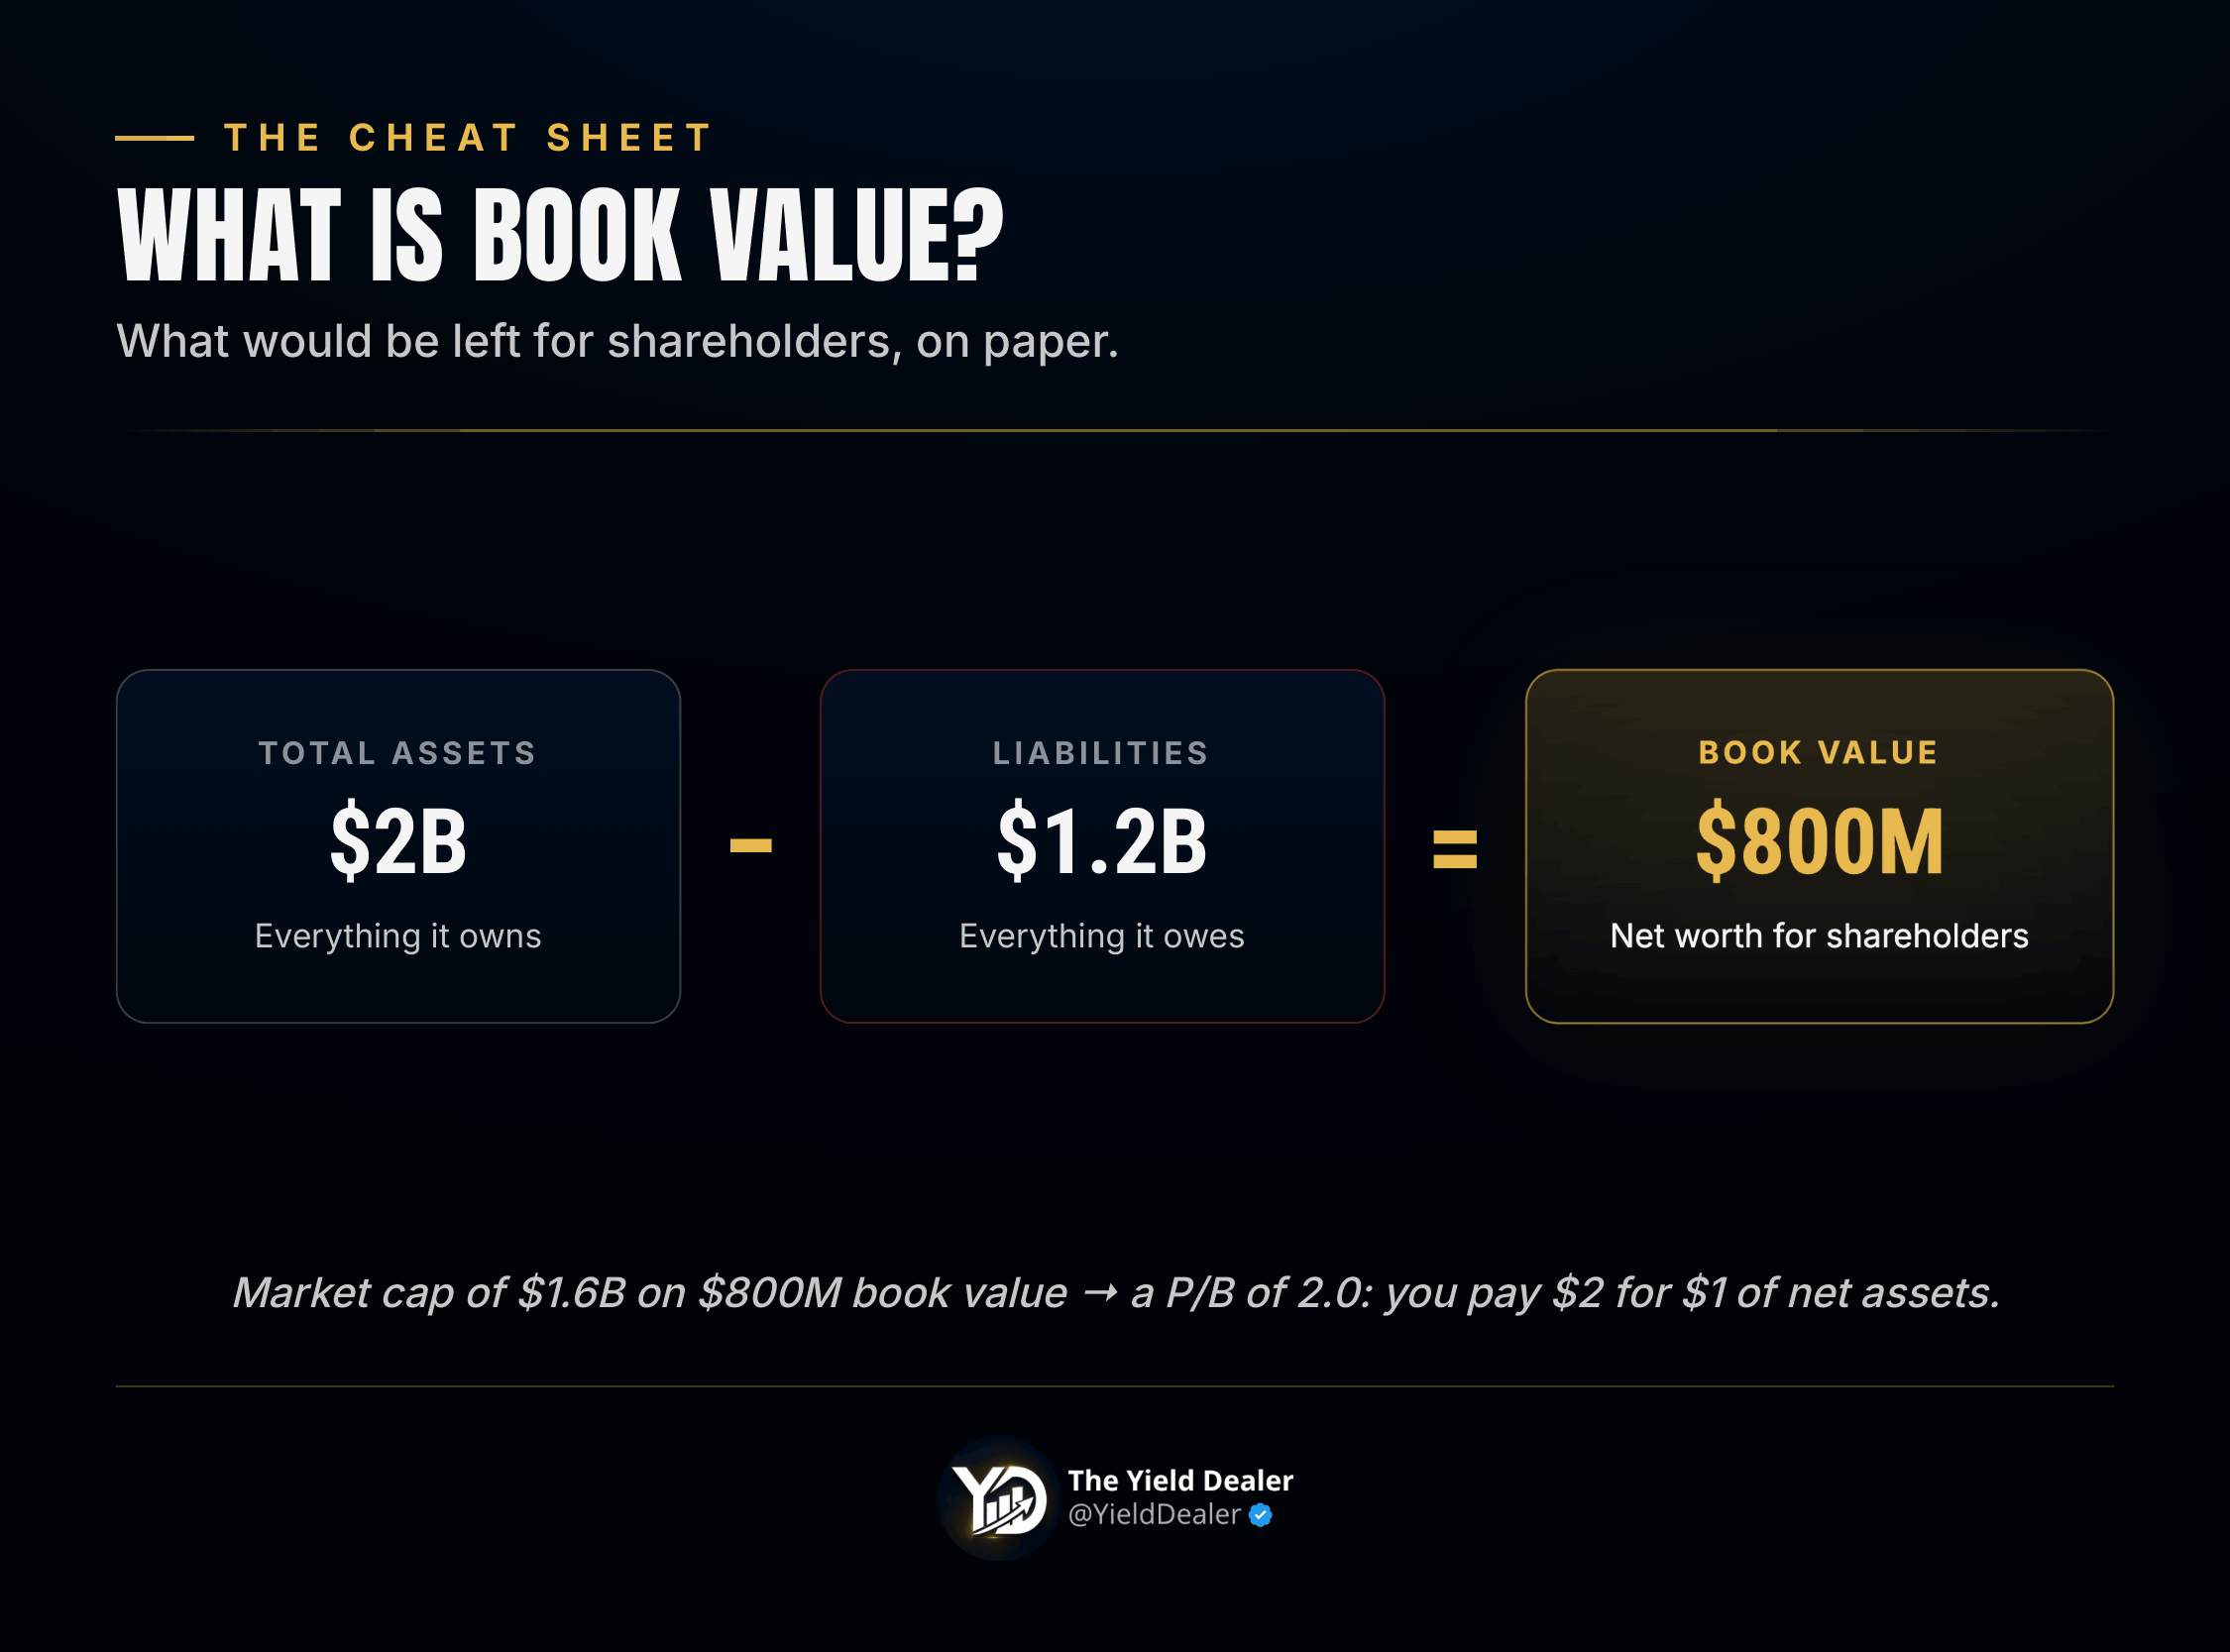
Example: A company has $2B in assets and $1.2B in liabilities. Its book value is $800M. If its market cap is $1.6B, its P/B is 2.0 — investors are paying $2 for every $1 of net assets on the books.
How to read it
P/B < 1 — the market values the company at less than its accounting net worth. Potentially undervalued — or a signal the market expects those assets to lose value or the company to destroy capital.
P/B ≈ 1 – 3 — a common, reasonable range for many established businesses.
P/B > 3 — investors are paying a large premium over book value, usually because the company earns high returns on its equity or owns valuable assets the balance sheet doesn’t capture.
But here’s the catch that trips up most investors: these bands are almost meaningless without context. A P/B of 5 can be perfectly fair; a P/B of 0.8 can be a warning sign.
Why book value means less than it used to
This is the single most important thing to understand about P/B in the US market today.
Book value does a good job of capturing physical, tangible assets — cash, inventory, buildings, machinery, land. It does a poor job with intangible assets — brands, patents, software, network effects, customer relationships, and R&D.
In an economy built on brands, code, and networks, the best businesses live where the balance sheet can't see them.
The problem: the modern US economy is dominated by asset-light, intangible-rich companies. A software company, a payment network, or a consumer brand can generate enormous profits with very little on its balance sheet. Under US accounting rules (GAAP), most internally developed intangibles — the brand Coca-Cola built over a century, the code a software firm writes, the research a pharma company funds — are expensed, not capitalized. They barely show up in book value.
The result: the best businesses in America often trade at very high P/B ratios, not because they’re overpriced, but because their real value lives in things the balance sheet ignores. This is why P/B has fallen out of favor for judging tech and consumer names — and why a naive “low P/B = cheap” screen increasingly surfaces bad businesses, not bargains.
The value trap
A low P/B is where inexperienced value investors get hurt most often.
A low P/B isn’t a bargain — it’s a question. Why is the market pricing these assets below their stated worth?
When a stock trades below book value (P/B < 1), it looks like you’re buying a dollar of assets for 80 cents. Sometimes that’s a genuine opportunity — the market can overreact to bad news or temporarily abandon a whole sector. But very often, a low P/B is the market telling you something:
The assets on the books are worth less than stated (obsolete inventory, aging factories, bad loans).
The company is destroying value — earning a return on equity below its cost of capital.
The business is in structural decline (think struggling retailers, legacy media, or fading industrials).
The rule: a low P/B is only attractive if the assets are real, the business is stable, and management isn’t burning shareholder capital. P/B and ROE must be read together — a low P/B with a healthy, sustainable ROE is interesting; a low P/B with a collapsing ROE is usually a trap.
The P/B and ROE connection
This is the key that unlocks P/B. The two ratios are mathematically linked, and reading them as a pair tells you far more than either alone.
P/B and ROE are two halves of one answer. Read one without the other and you'll misprice the stock.
High ROE justifies a high P/B. A company that consistently earns 25% on its equity should trade well above book value — it’s turning each dollar of equity into a lot of profit, so that dollar is worth more than its accounting value.
Low ROE deserves a low P/B. A company earning 4% on equity shouldn’t command a premium — its assets aren’t generating much.
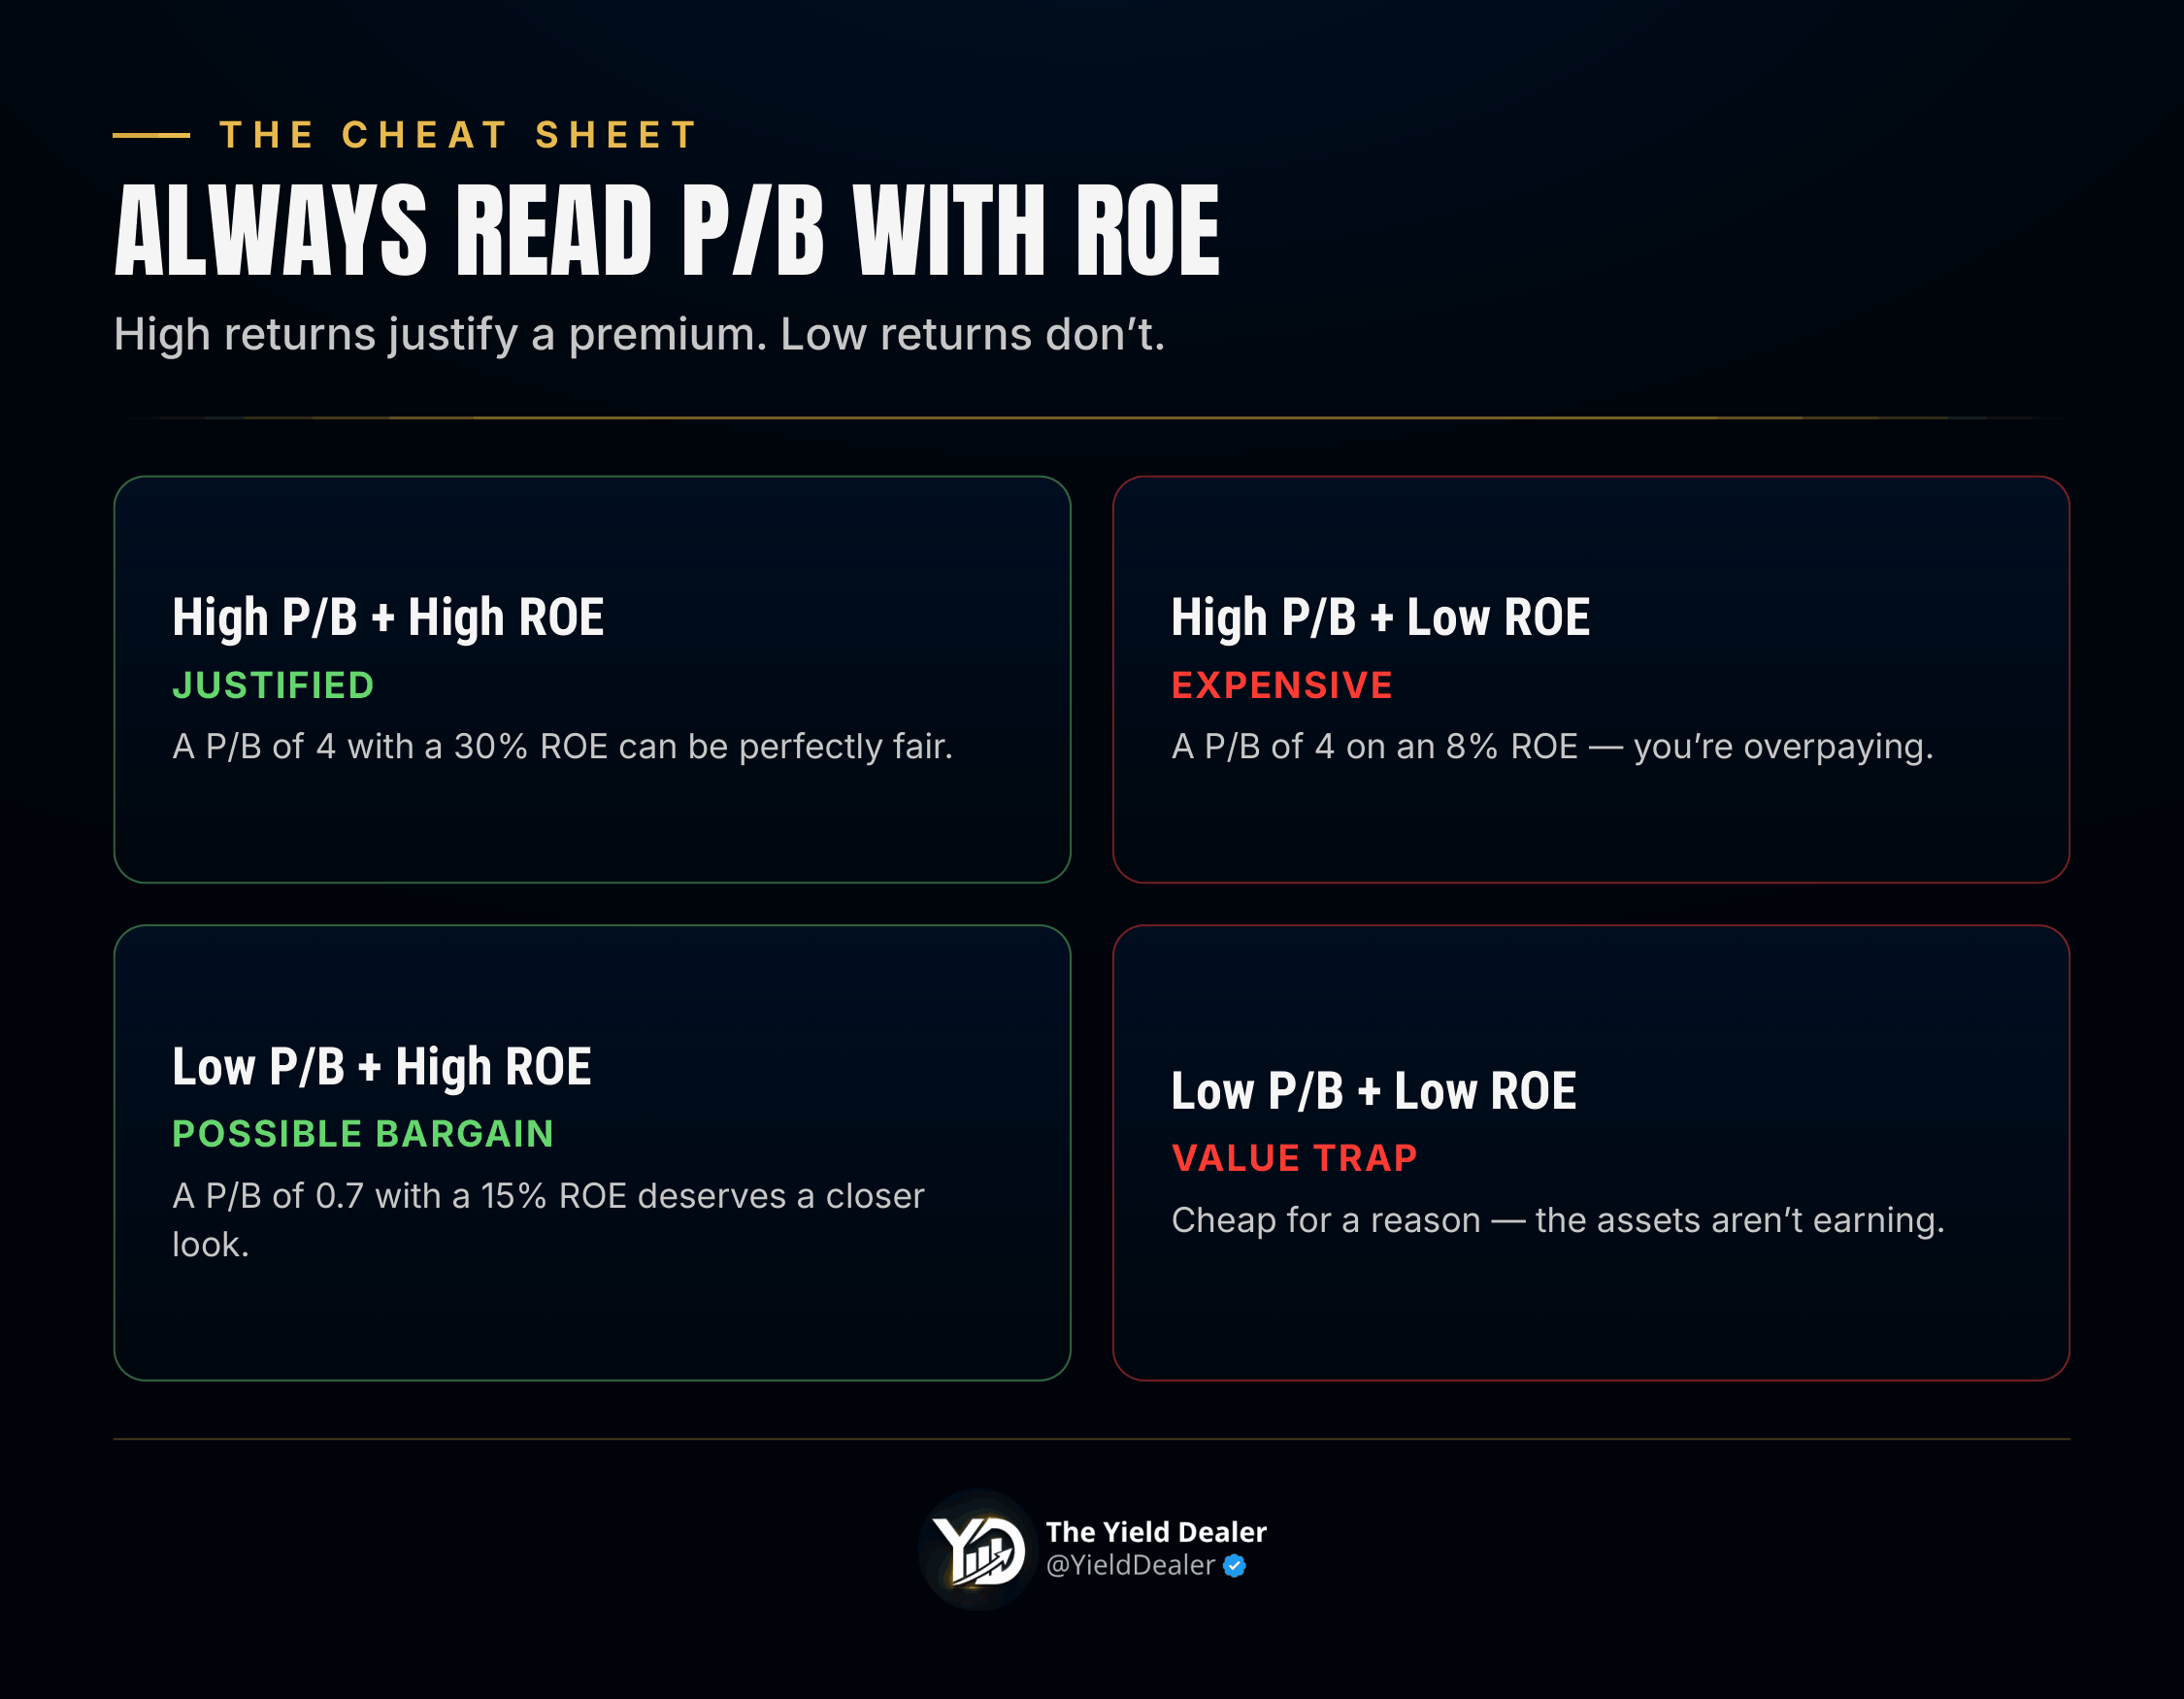
So when you see a stock’s P/B, immediately ask: is the ROE high enough to justify it? A P/B of 4 with a 30% ROE can be reasonable. A P/B of 4 with an 8% ROE is expensive. A P/B of 0.7 with a 15% ROE might be a real bargain.
Where P/B still shines: financials
There’s one corner of the US market where P/B remains the primary valuation tool: banks, insurers, and other financial companies.
Why? Because their balance sheets are made up almost entirely of financial assets — loans, securities, cash — that are marked close to fair value. For a bank, book value is a genuinely meaningful number, not an accounting relic. This is why analysts value banks like JPMorgan, Bank of America, or Wells Fargo primarily on Price-to-Book and Price-to-Tangible-Book, alongside return on equity.
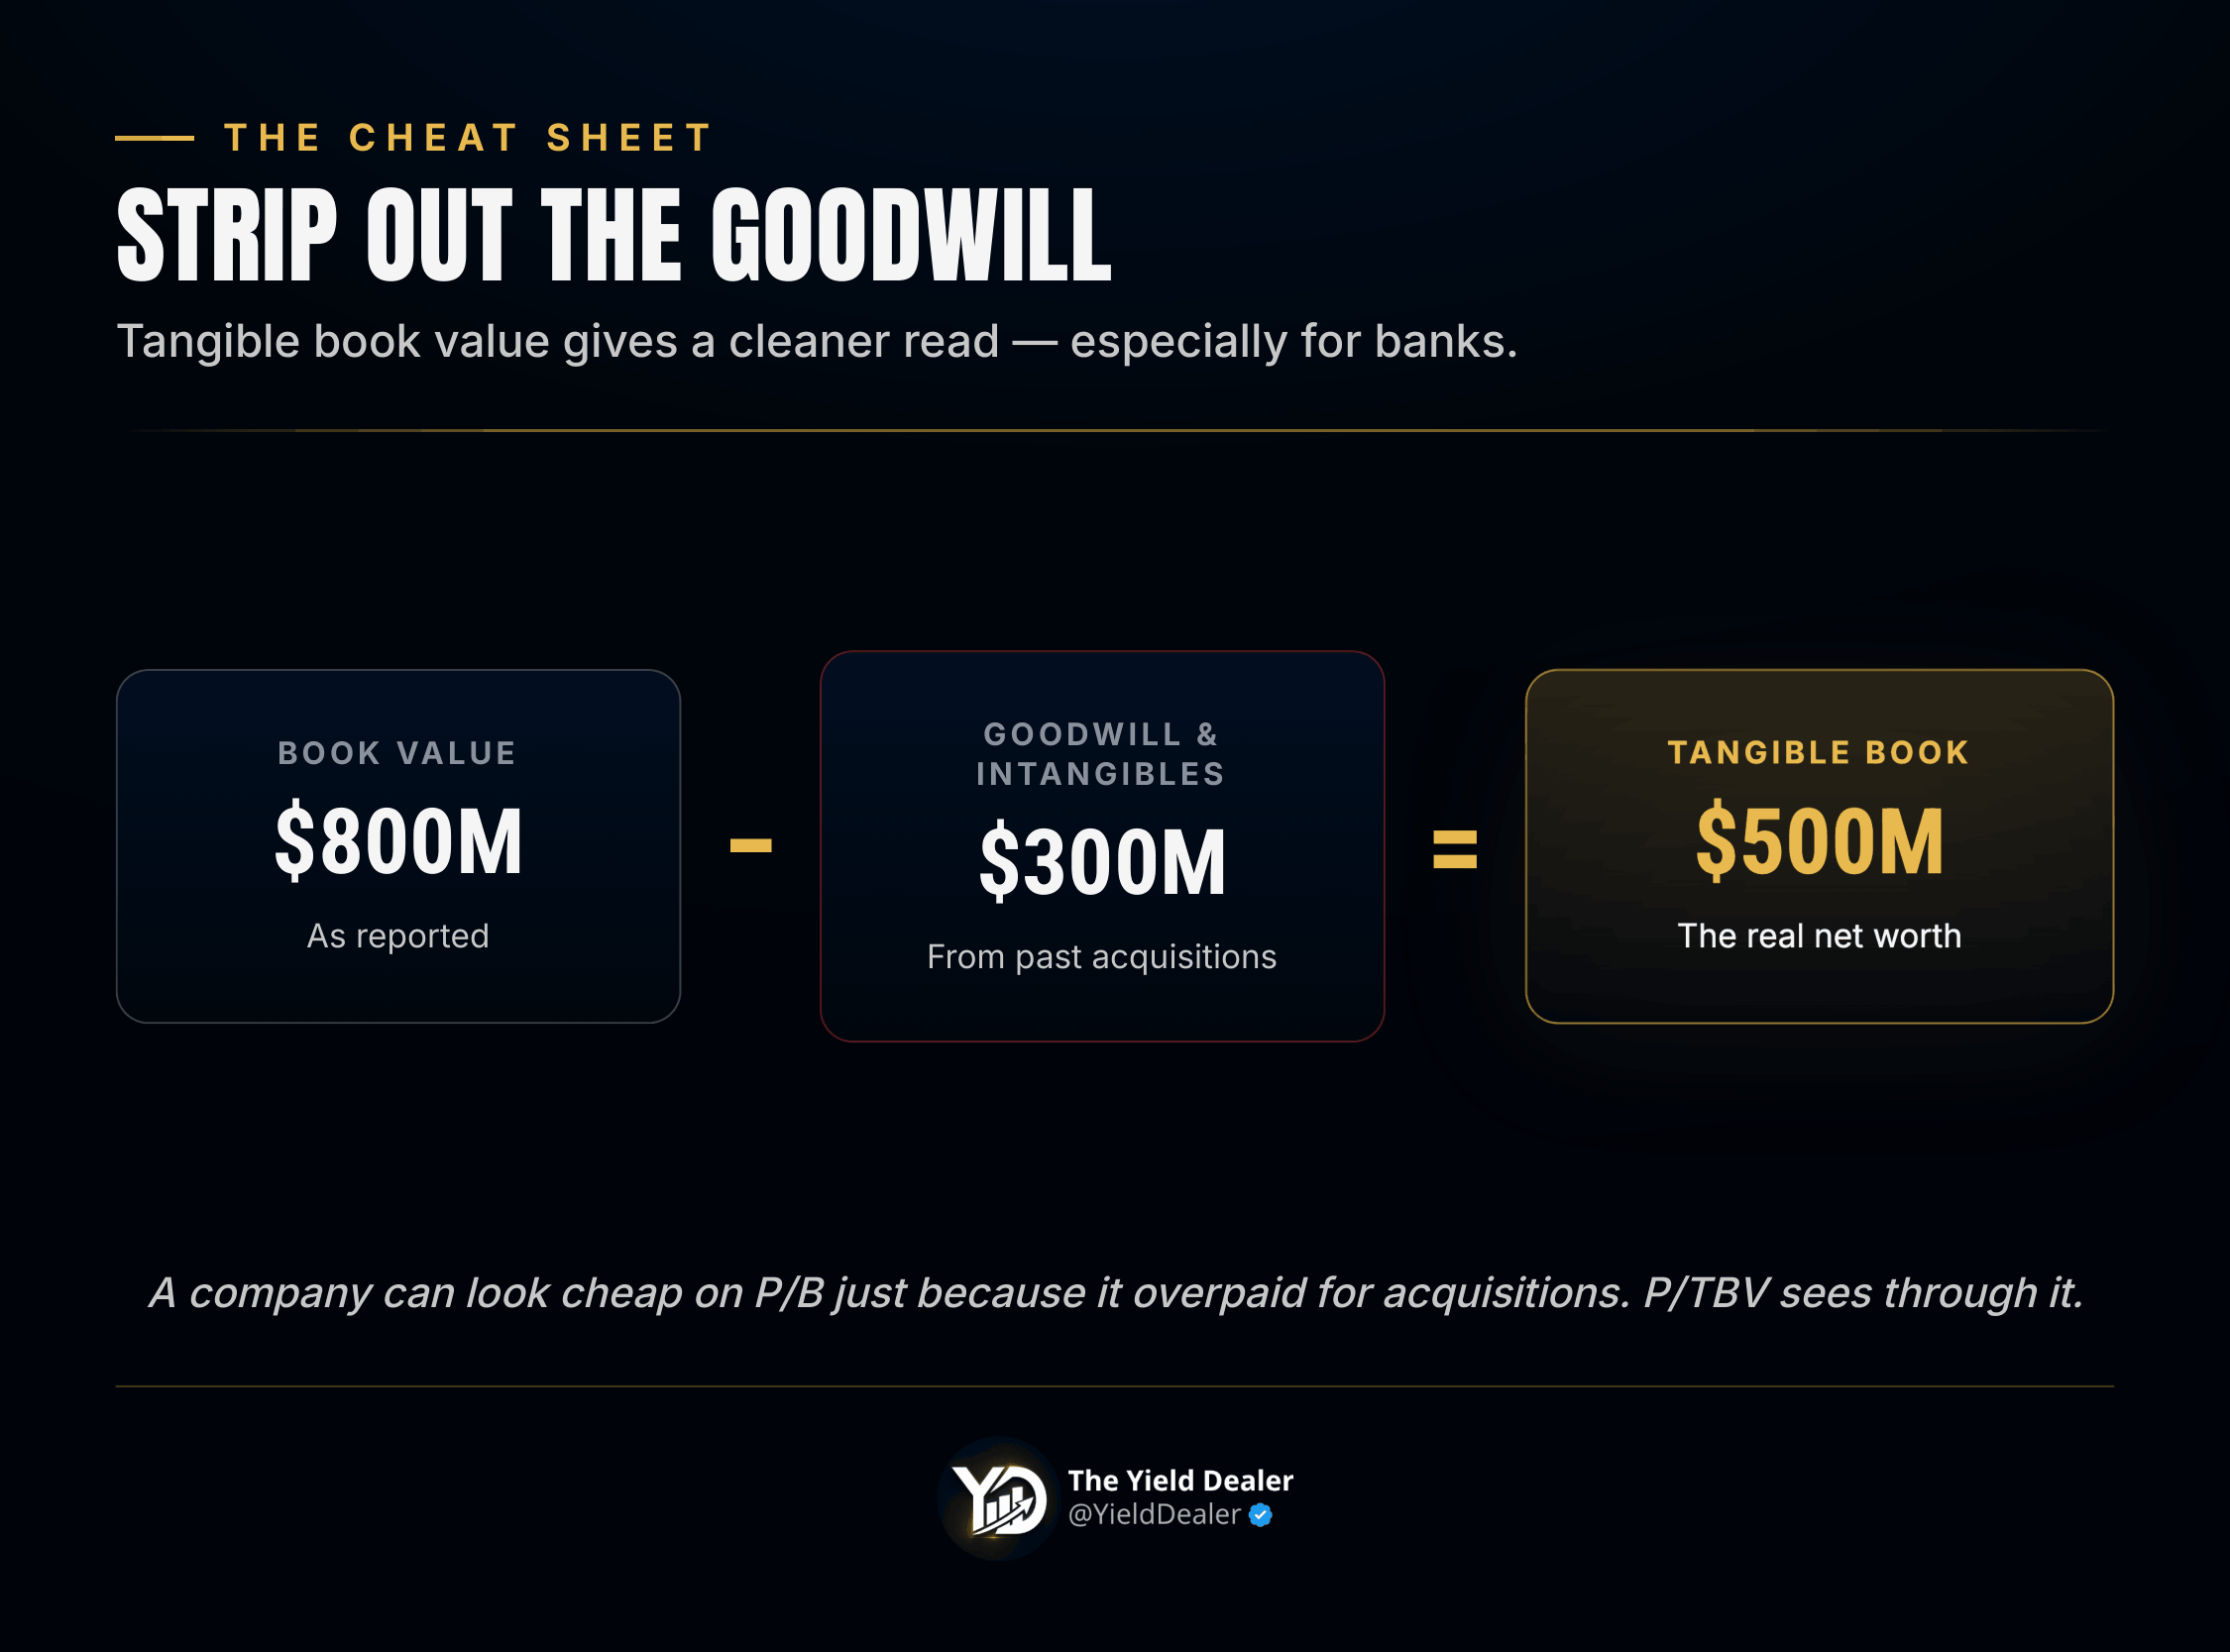
A useful refinement here is tangible book value — book value stripped of goodwill and intangibles — which gives a cleaner read on a financial company’s real net worth. The ratio P/TBV (Price to Tangible Book) is a bank-investor staple.
Where P/B is nearly useless
By contrast, P/B tells you very little about:
Software and tech — value is in code, data, and network effects, none of which sit on the balance sheet.
Consumer brands — the brand itself is the asset, and it’s largely invisible in book value.
Services and asset-light businesses — little physical capital, so book value is tiny relative to earning power.
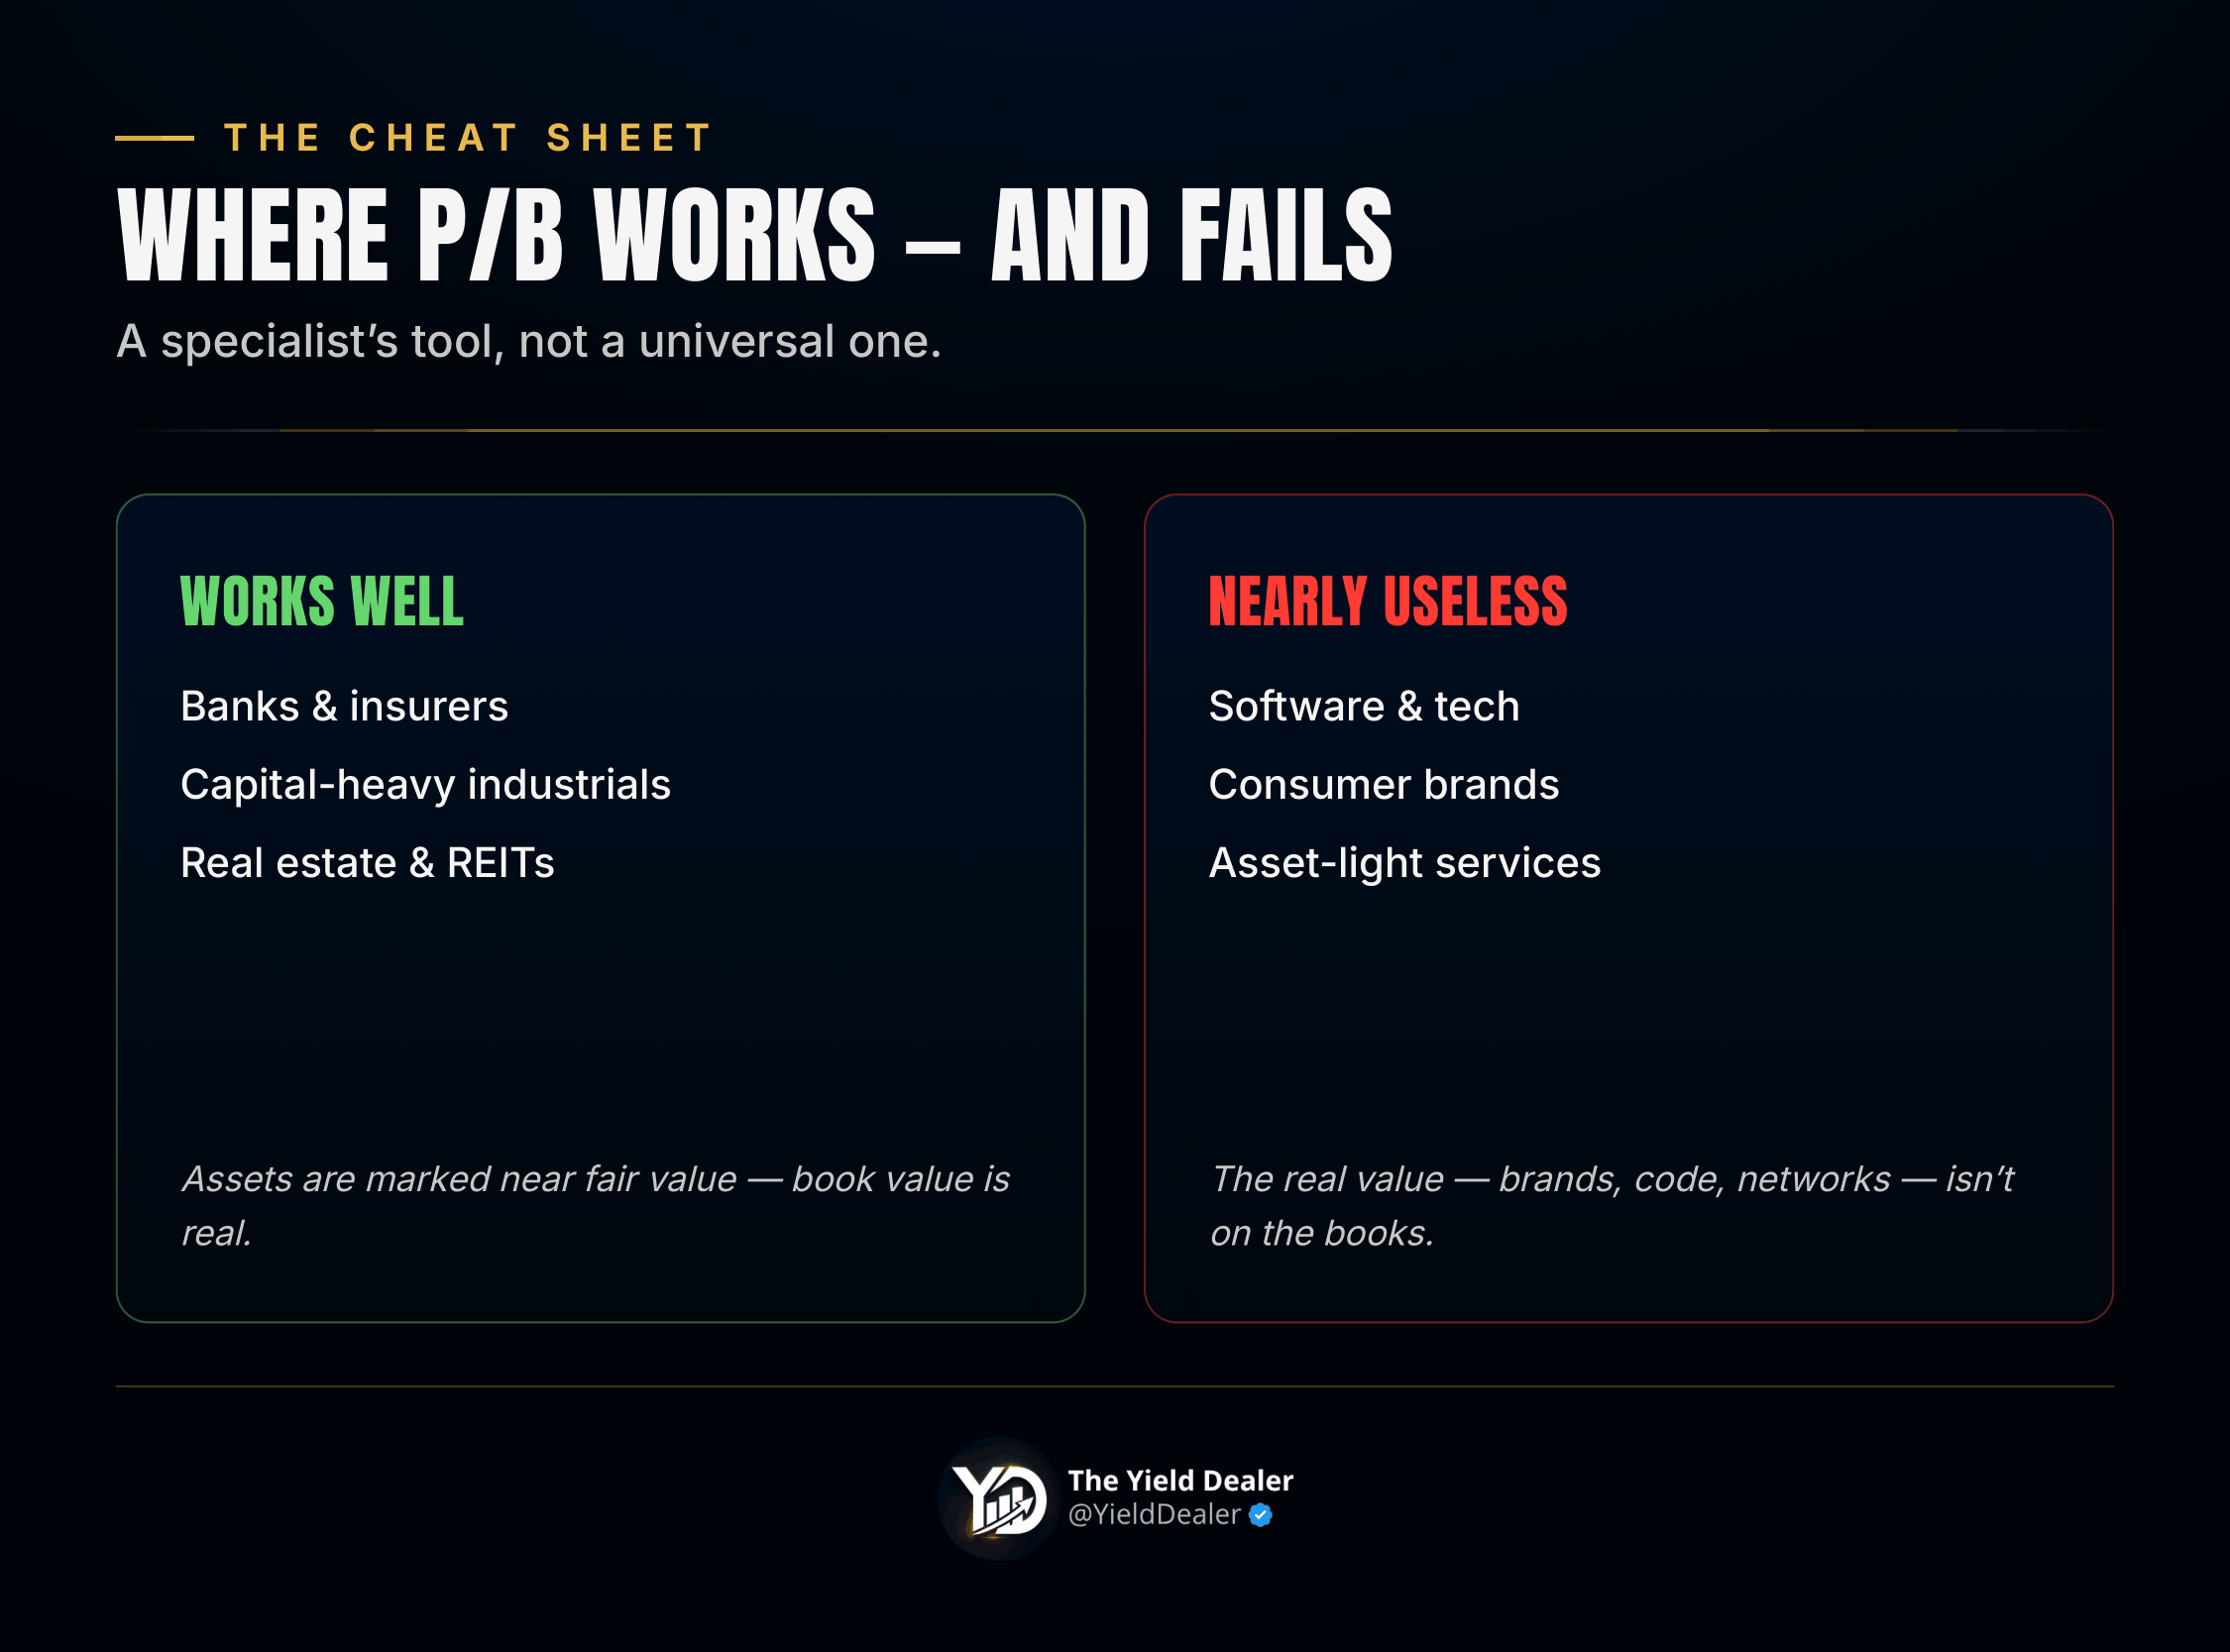
For these, lean on P/E, EV/EBITDA, P/FCF, and growth-adjusted measures instead.
The traps and distortions to watch
Buybacks can distort it. When a US company buys back stock above book value — which is most of the time — it reduces book equity, mechanically pushing P/B up. Heavy repurchasers (a very American habit) can show an optically high P/B, or even negative book value, without being expensive in any real sense.
Goodwill inflates it. When a company makes acquisitions, the premium it pays lands on the balance sheet as goodwill, padding book value. A company can look cheaper on P/B simply because it overpaid for acquisitions — which is the opposite of good news. This is exactly why tangible book value (goodwill excluded) is often the better lens.
Write-downs and one-offs. Book value can drop sharply after an impairment charge, or be distorted by accumulated losses. Always ask what’s actually inside the equity number.
Negative book value. Some highly profitable US companies (heavy buyback programs, or debt-funded payouts) actually report negative book value — making P/B meaningless. That doesn’t mean the company is worthless; it means this ratio simply doesn’t apply.
How to actually use P/B in your analysis
Start with the sector. P/B is essential for banks and insurers, useful for capital-heavy industrials and real estate, and mostly irrelevant for software, brands, and services.
Never read it without ROE. The P/B only makes sense in light of how much profit the company generates on its equity.
Prefer tangible book value when goodwill or acquisitions are involved — especially for financials.
Interrogate a low P/B. Below 1, assume it’s a value trap until you can prove the assets are real and the business is sound.
Compare to the company’s own history and its direct peers, never to the market as a whole.
Bottom line
The P/B ratio compares a company’s market price to the accounting value of what it owns. In the age of Graham and physical, asset-heavy businesses, it was a cornerstone of value investing. Today, in an American market dominated by intangible-rich, asset-light companies, it’s a specialist’s tool — indispensable for financials, useful for capital-heavy sectors, and misleading for almost everything else.
Used alone, P/B invites value traps. Used alongside ROE, on the right kind of company, and with an eye on tangible book value, it remains one of the sharpest ways to answer a fundamental question: am I paying a fair price for what this business actually owns — and for how well it uses it?


Want to get The Yield Dealer’s Newsletter in your inbox? Join other readers here.
Want short ideas on living and working on your own terms? Follow me on X/Twitter and Instagram.