


There’s a simple truth in investing that’s easy to forget: over the long run, a company is worth the cash it can generate. A business can report positive net income, grow its revenue, and talk up improving margins — and still produce very little actual cash for its shareholders. Others look unremarkable, yet throw off steady, reliable cash year after year.
The Price-to-Free-Cash-Flow ratio (P/FCF) is built to see exactly that. It compares a company’s market value to the free cash flow it produces, answering one concrete question: how much are investors paying today for every dollar of available cash the business generates?
It’s a favorite of fundamental investors because it focuses on the money actually left over after the spending required to keep the business running and growing. It doesn’t just look at accounting profit. It looks at cash.
First, what is free cash flow?
Before P/FCF makes sense, you have to understand free cash flow (FCF) — the cash left after a company pays for the investments needed to stay in business.
Free Cash Flow = Operating Cash Flow − Capital Expenditures (CapEx)
Operating cash flow is the cash produced by the day-to-day business. CapEx is the money reinvested in the assets the company needs to operate or grow — machines, factories, servers, software, equipment, stores, infrastructure.
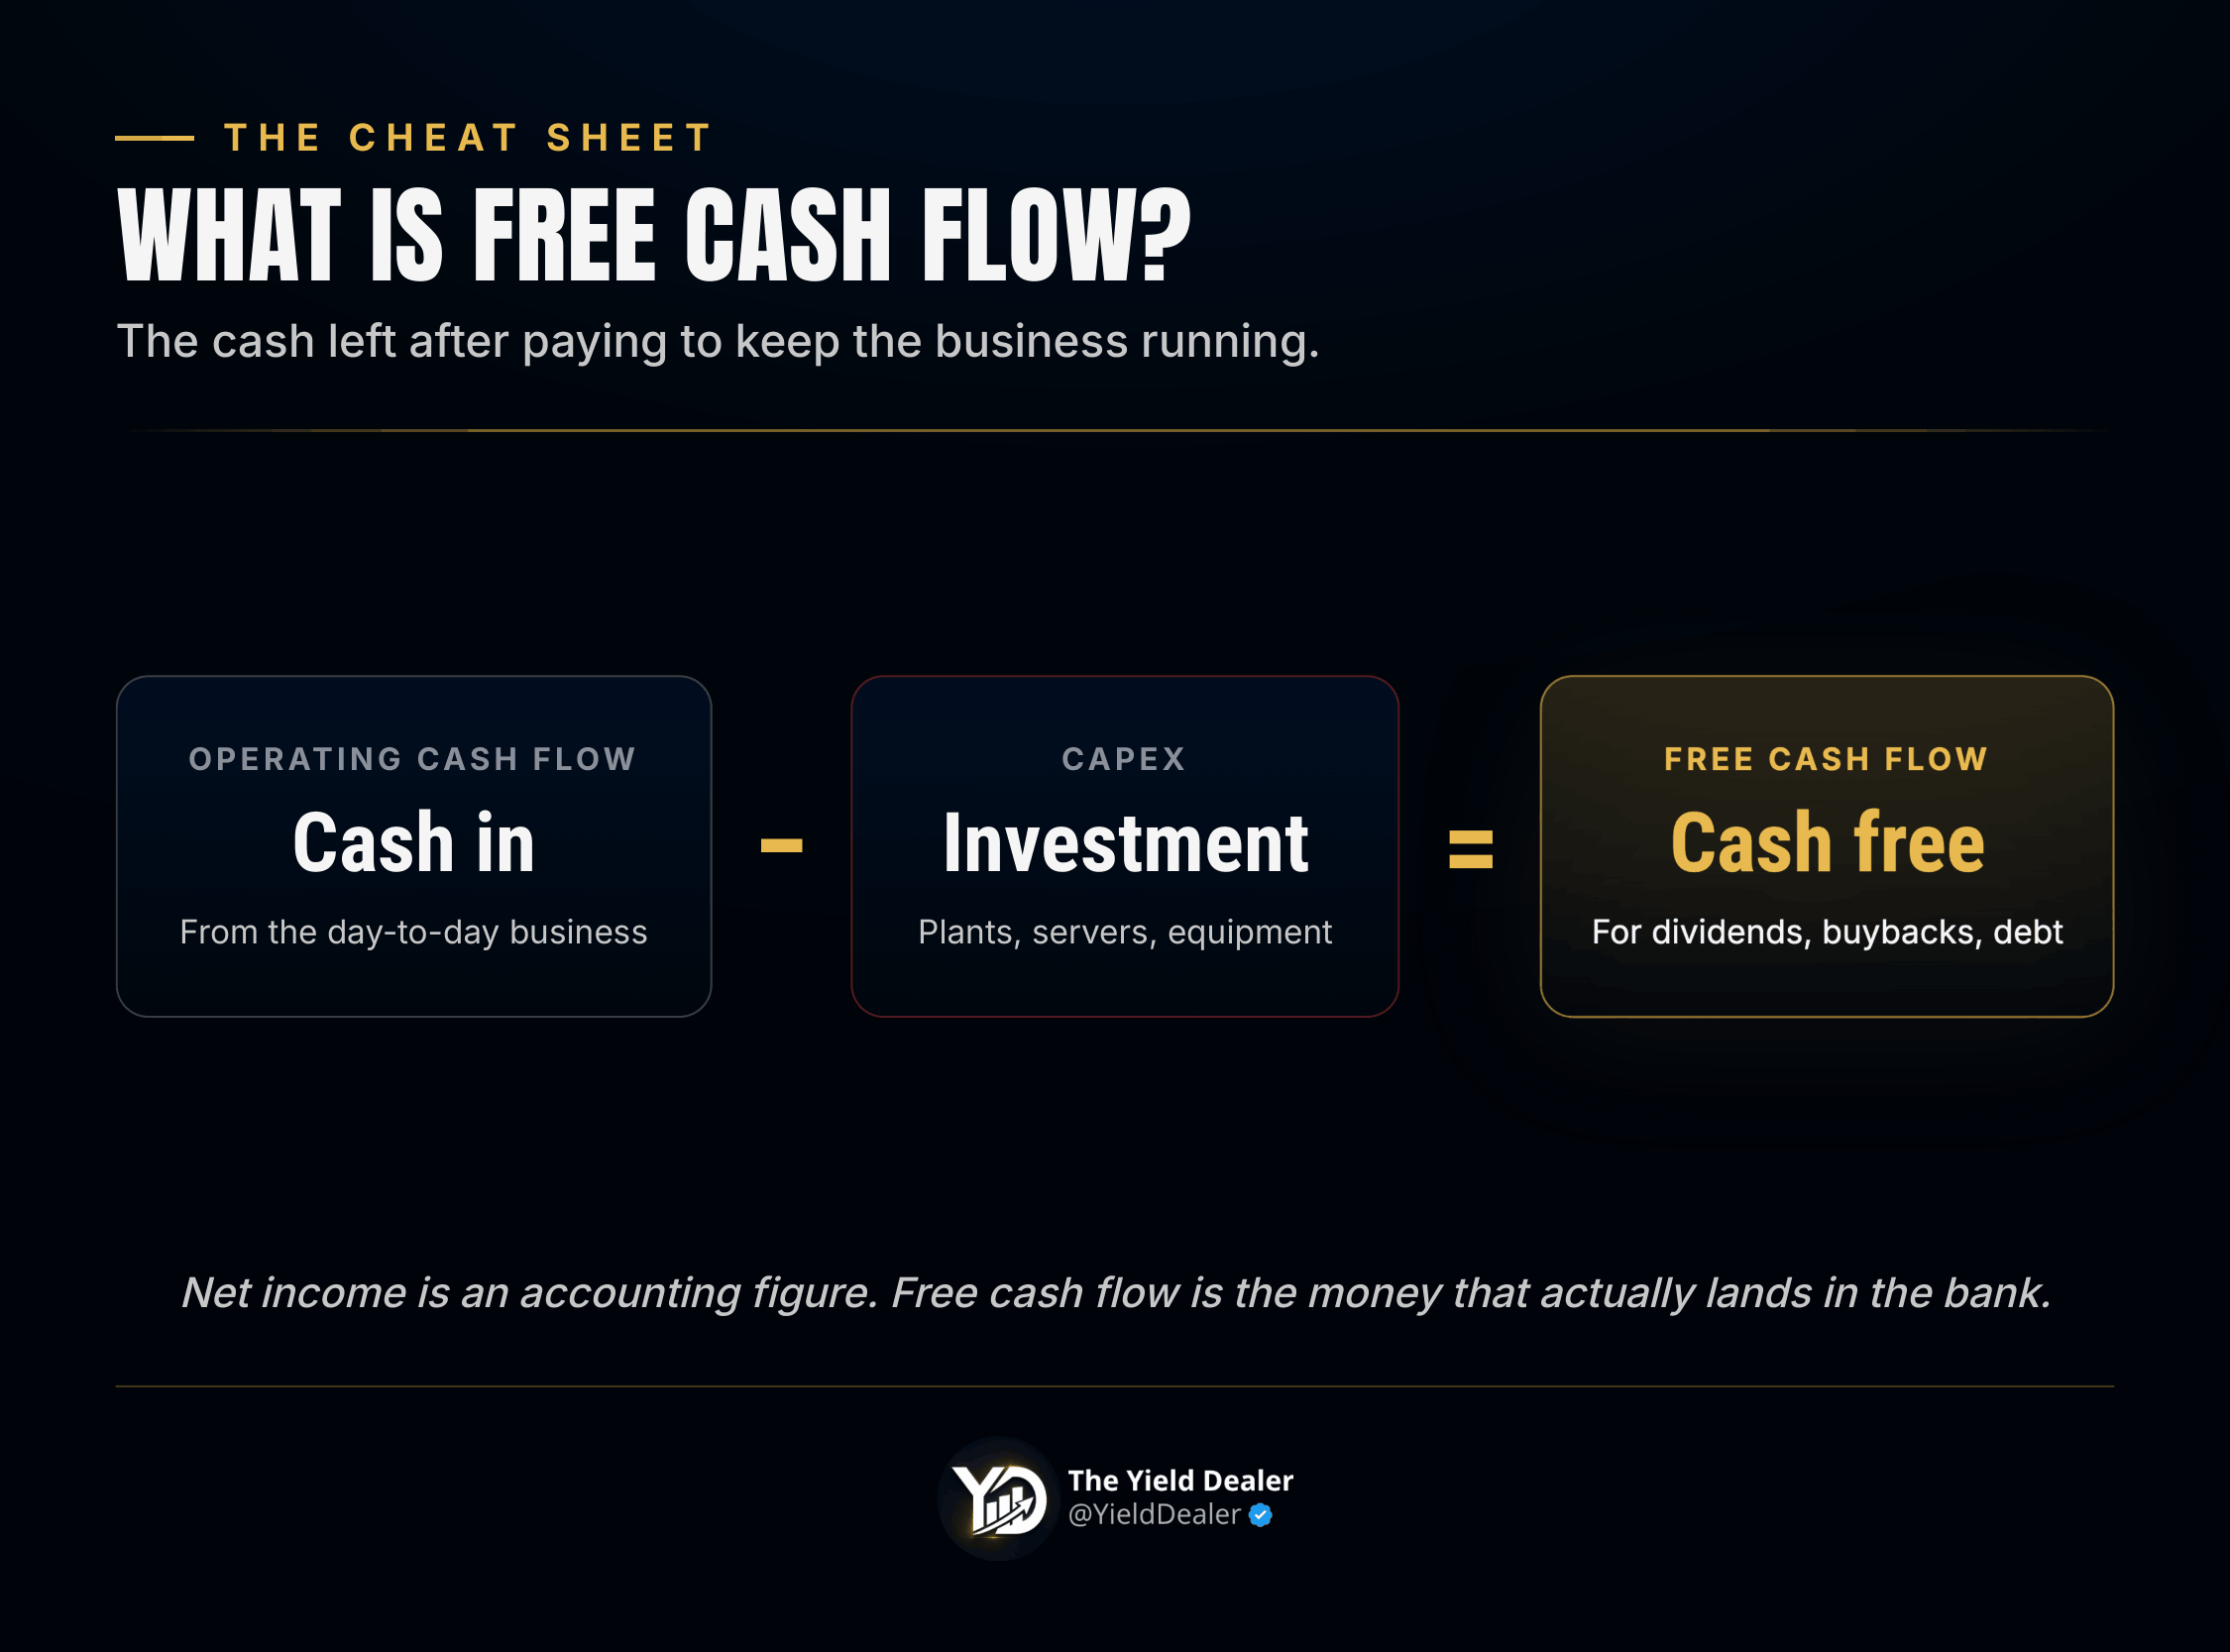
Free cash flow is what remains after paying for the necessities. It’s the cash that can then go to paying down debt, dividends, buybacks, acquisitions, strengthening the balance sheet, or building a war chest for future investment.
That’s why it’s often seen as more concrete than net income. Net income is an accounting figure. Free cash flow is closer to economic reality — the money that actually lands in the bank once investment is accounted for.
The formula
P/FCF = Market Cap ÷ Free Cash Flow
Market cap is the price of one share times the number of shares outstanding. Free cash flow is usually taken over the trailing twelve months or the last full fiscal year.
Example: A company worth $10B generating $1B of free cash flow trades at a P/FCF of 10 — investors pay $10 for every $1 of annual free cash flow. Another company worth $30B on the same $1B of FCF trades at 30 — far more expensive by this measure, because the market pays $30 for each dollar of cash.
The logic mirrors the P/E, which compares price to net income. But P/FCF uses free cash flow instead of earnings — often a more realistic read on valuation, especially when accounting profit doesn’t reflect the true cash the business produces.
What a P/FCF actually means: the cash yield
A P/FCF of 10 means the market values the company at 10× its annual free cash flow. Flip it over, and you get the free cash flow yield: 1 ÷ 10 = a 10% FCF yield.

P/FCF of 20 → 5% yield
P/FCF of 25 → 4% yield
P/FCF of 5 → 20% yield
This implied yield is powerful because it lets you think like a business owner. Buy a company for $100M that generates $10M of FCF a year, and you’re earning a 10% annual return before any growth, added debt, or change in valuation. Markets are more complicated than that — FCF can rise, fall, or turn negative — but it’s an extremely useful first anchor.
The lower the P/FCF, the less investors are paying for the cash. The higher it is, the more they’re willing to pay — usually because they expect strong future growth, exceptional quality, or highly visible cash flows.
A low P/FCF isn’t always a bargain
The classic mistake: assuming a low P/FCF automatically means cheap. Not always.
A low ratio can flag a real opportunity — a solid, profitable, low-debt company producing steady FCF but priced at only 8–10× that cash. The market may simply be too pessimistic, or the stock temporarily out of favor.
But a low P/FCF can just as easily be a trap. It may mean the market expects future FCF to fall — from competitive pressure, customer losses, margin compression, technological change, tighter regulation, or a cyclical business near its peak. The ratio looks low because current FCF is high, but that cash may not last.
This is especially common in cyclical sectors. A mining, energy, auto, or heavy-industrial company can post a very low P/FCF at the top of its cycle, when selling prices are high and profits are inflated. If the cycle turns, FCF can collapse — and the “cheap” multiple was an illusion. A low P/FCF should always trigger one question: why is it low?
A high P/FCF isn’t always excessive
The reverse is equally true. A high P/FCF doesn’t automatically mean overpriced. Some companies deserve a premium — durable growth, high margins, an asset-light model, a strong moat, or excellent revenue visibility.
A company generating $1B of FCF today that can reasonably double or triple it can justify a high multiple, because the market isn’t just paying for today’s cash — it’s paying for tomorrow’s. This is often the case in software, digital platforms, payments, strong consumer brands, and highly profitable healthcare, where FCF can compound fast without heavy physical investment. The market may accept 25×, 30×, even 40×.
The danger appears when expectations get too optimistic. A very high P/FCF leaves little room for error. If growth slows or margins slip, the valuation can compress hard. The company can stay excellent while the stock becomes a poor investment — quality doesn’t protect you from overpaying.
Rough valuation bands
Use these as orientation, never as rules:
Below 10 — can look attractive, but check the stability of the cash flow, debt, cyclicality, and outlook. A low ratio may signal a real discount, a declining business, or temporarily inflated FCF.
10 – 20 — often a reasonable zone for a decent-quality, mature or moderately growing company with a good balance sheet and strong cash conversion.
20 – 30 — more demanding. The market is already paying for quality and future growth. Not necessarily excessive, but you should be able to explain why.
🔴 Above 30 — very expensive. Can be justified for exceptional, high-return compounders — but the margin for error shrinks, and any stumble gets punished.
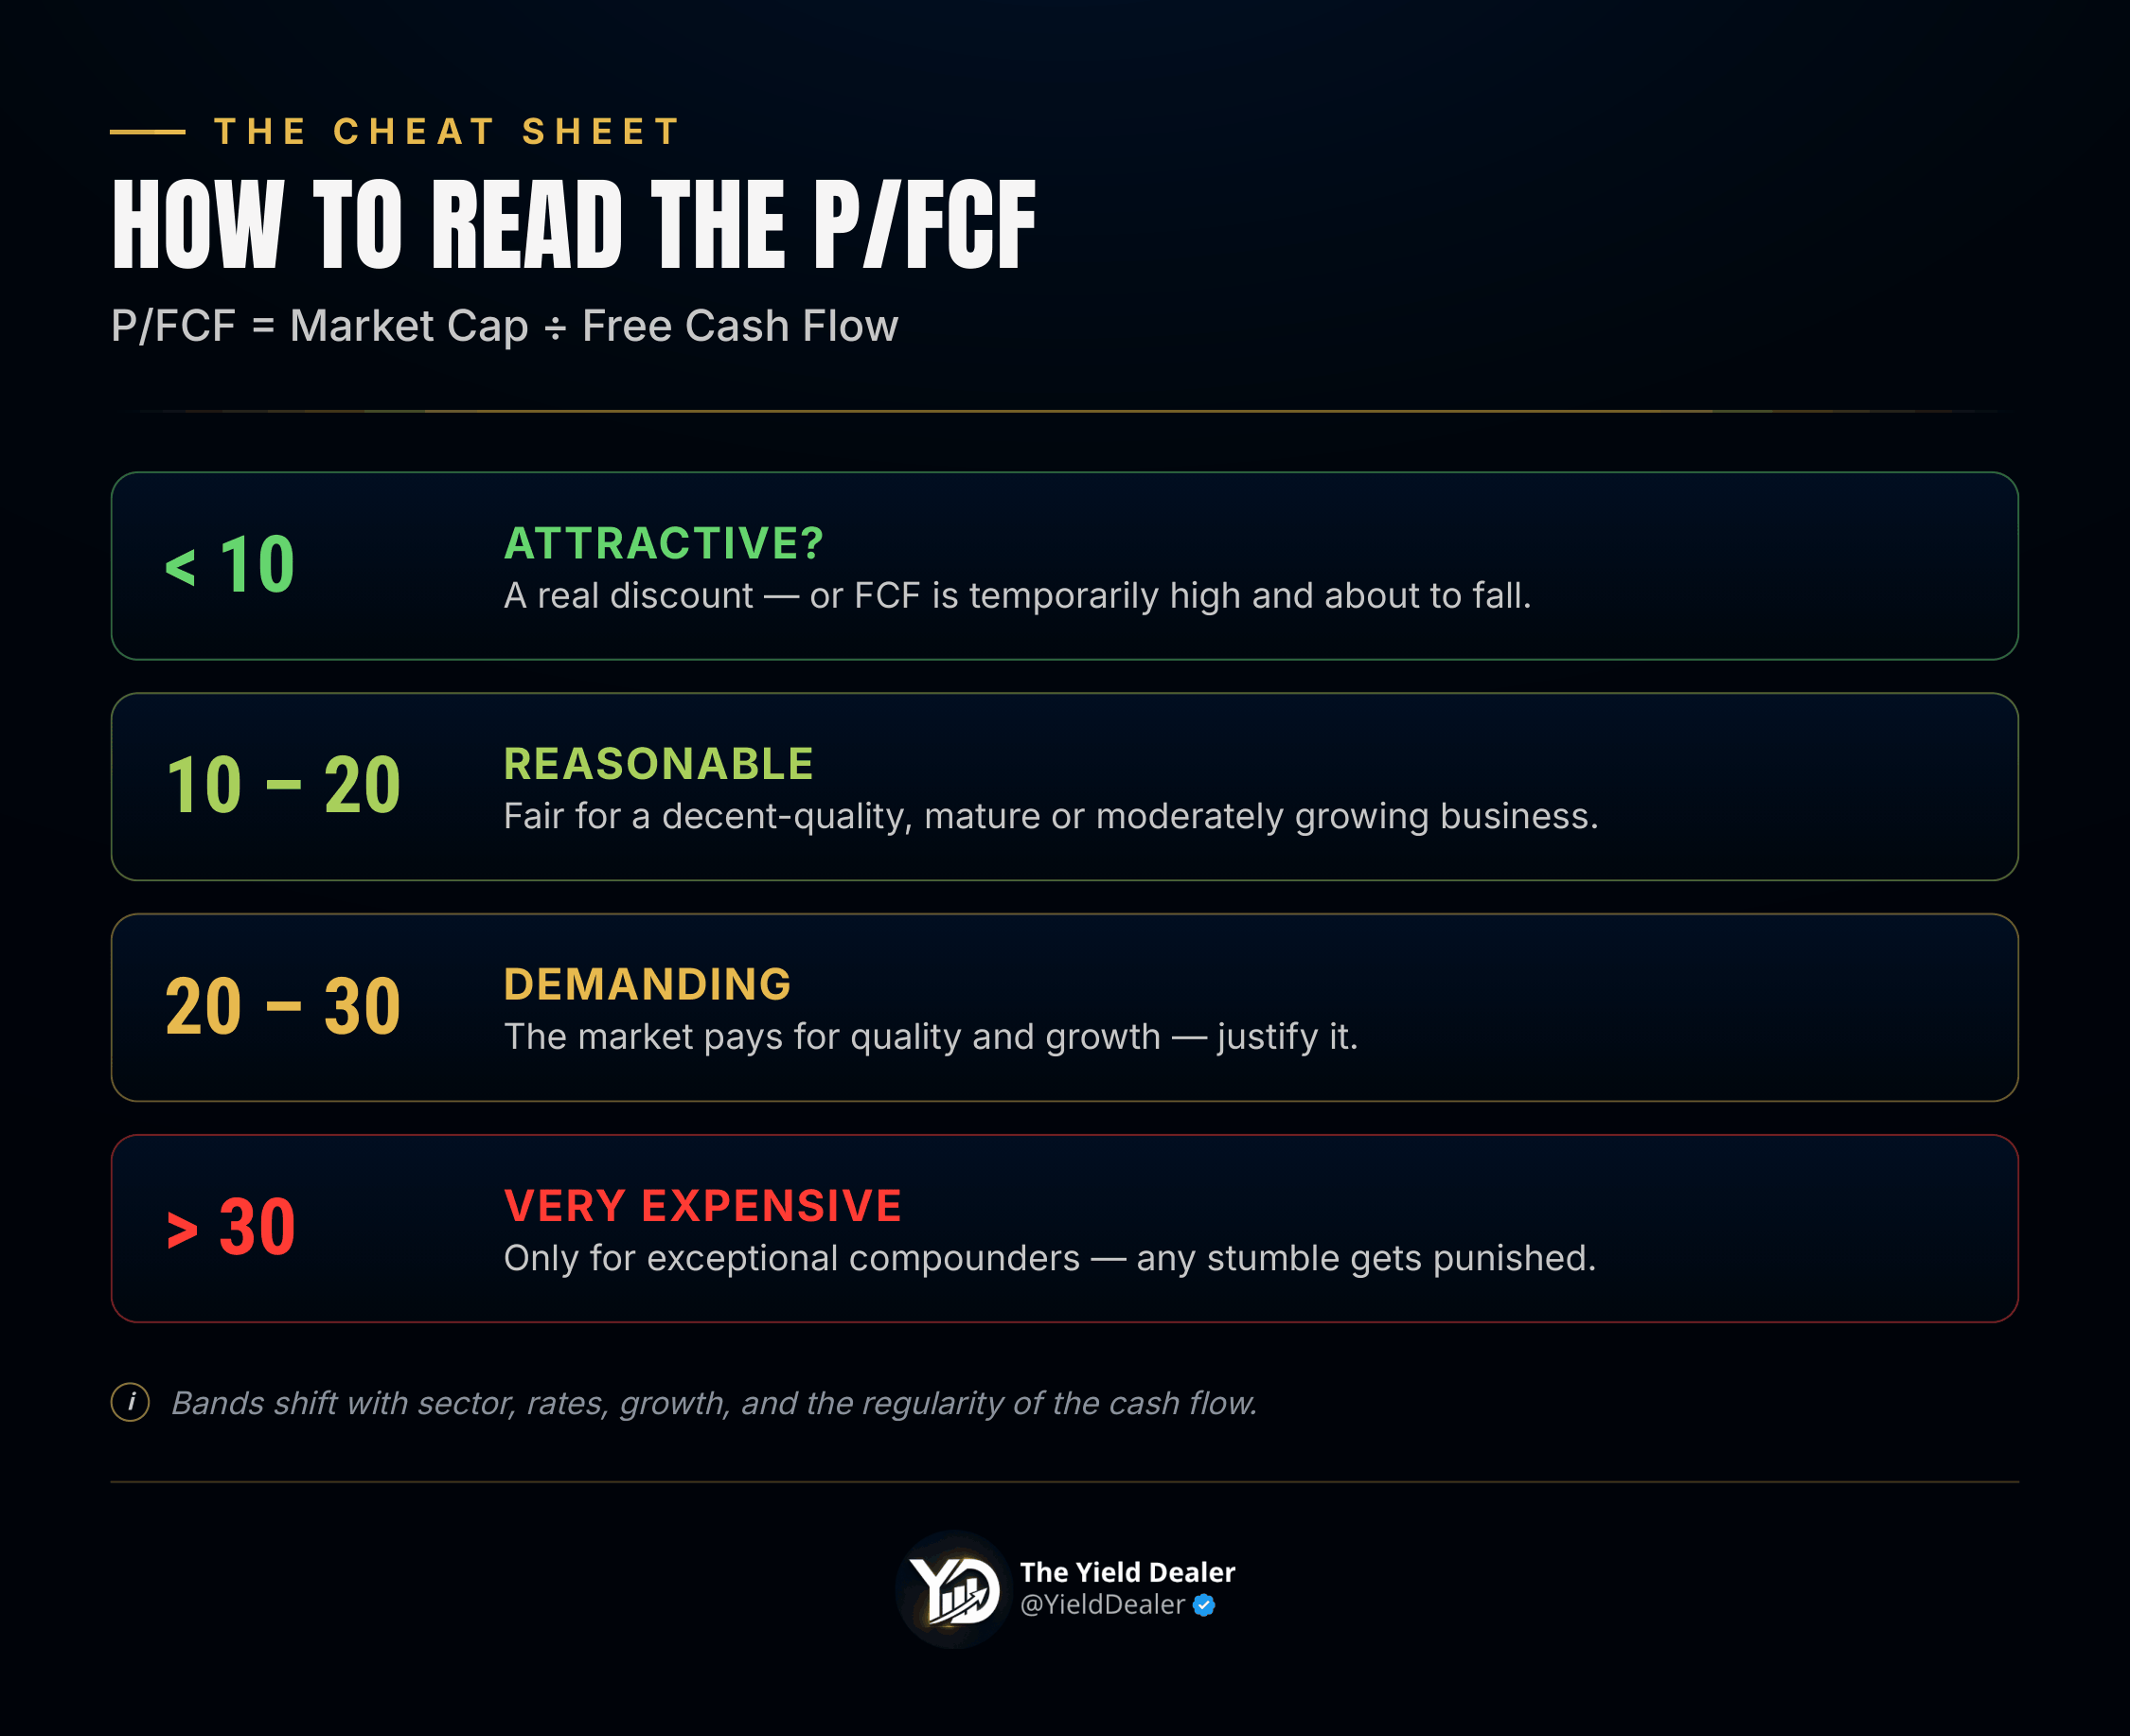
These bands shift with the sector, interest rates, expected growth, balance-sheet quality, and the regularity of the FCF.
Compare only comparable companies
P/FCF is most useful within a sector. A software firm, an industrial, a bank, a REIT, and an airline have entirely different capital needs and cash-flow stability. Asset-light companies convert much of their sales into FCF and can deserve higher multiples. Capital-heavy industrials must reinvest constantly just to maintain capacity, so their FCF is more volatile and cycle-dependent.
Comparing a software company’s P/FCF to an automaker’s tells you little. Judge a company against its direct peers, its own history, and its sector’s typical range. A stock can look expensive versus the whole market yet reasonable versus its peers — and vice versa.
The big limitation: debt
The simple P/FCF formula uses market cap, which ignores debt. Two companies can share the same market cap and the same FCF but have completely different balance sheets. If one is debt-free and the other heavily levered, they carry very different risk — and some of the levered company’s FCF will have to service interest and repay debt, so it isn’t fully available to shareholders.
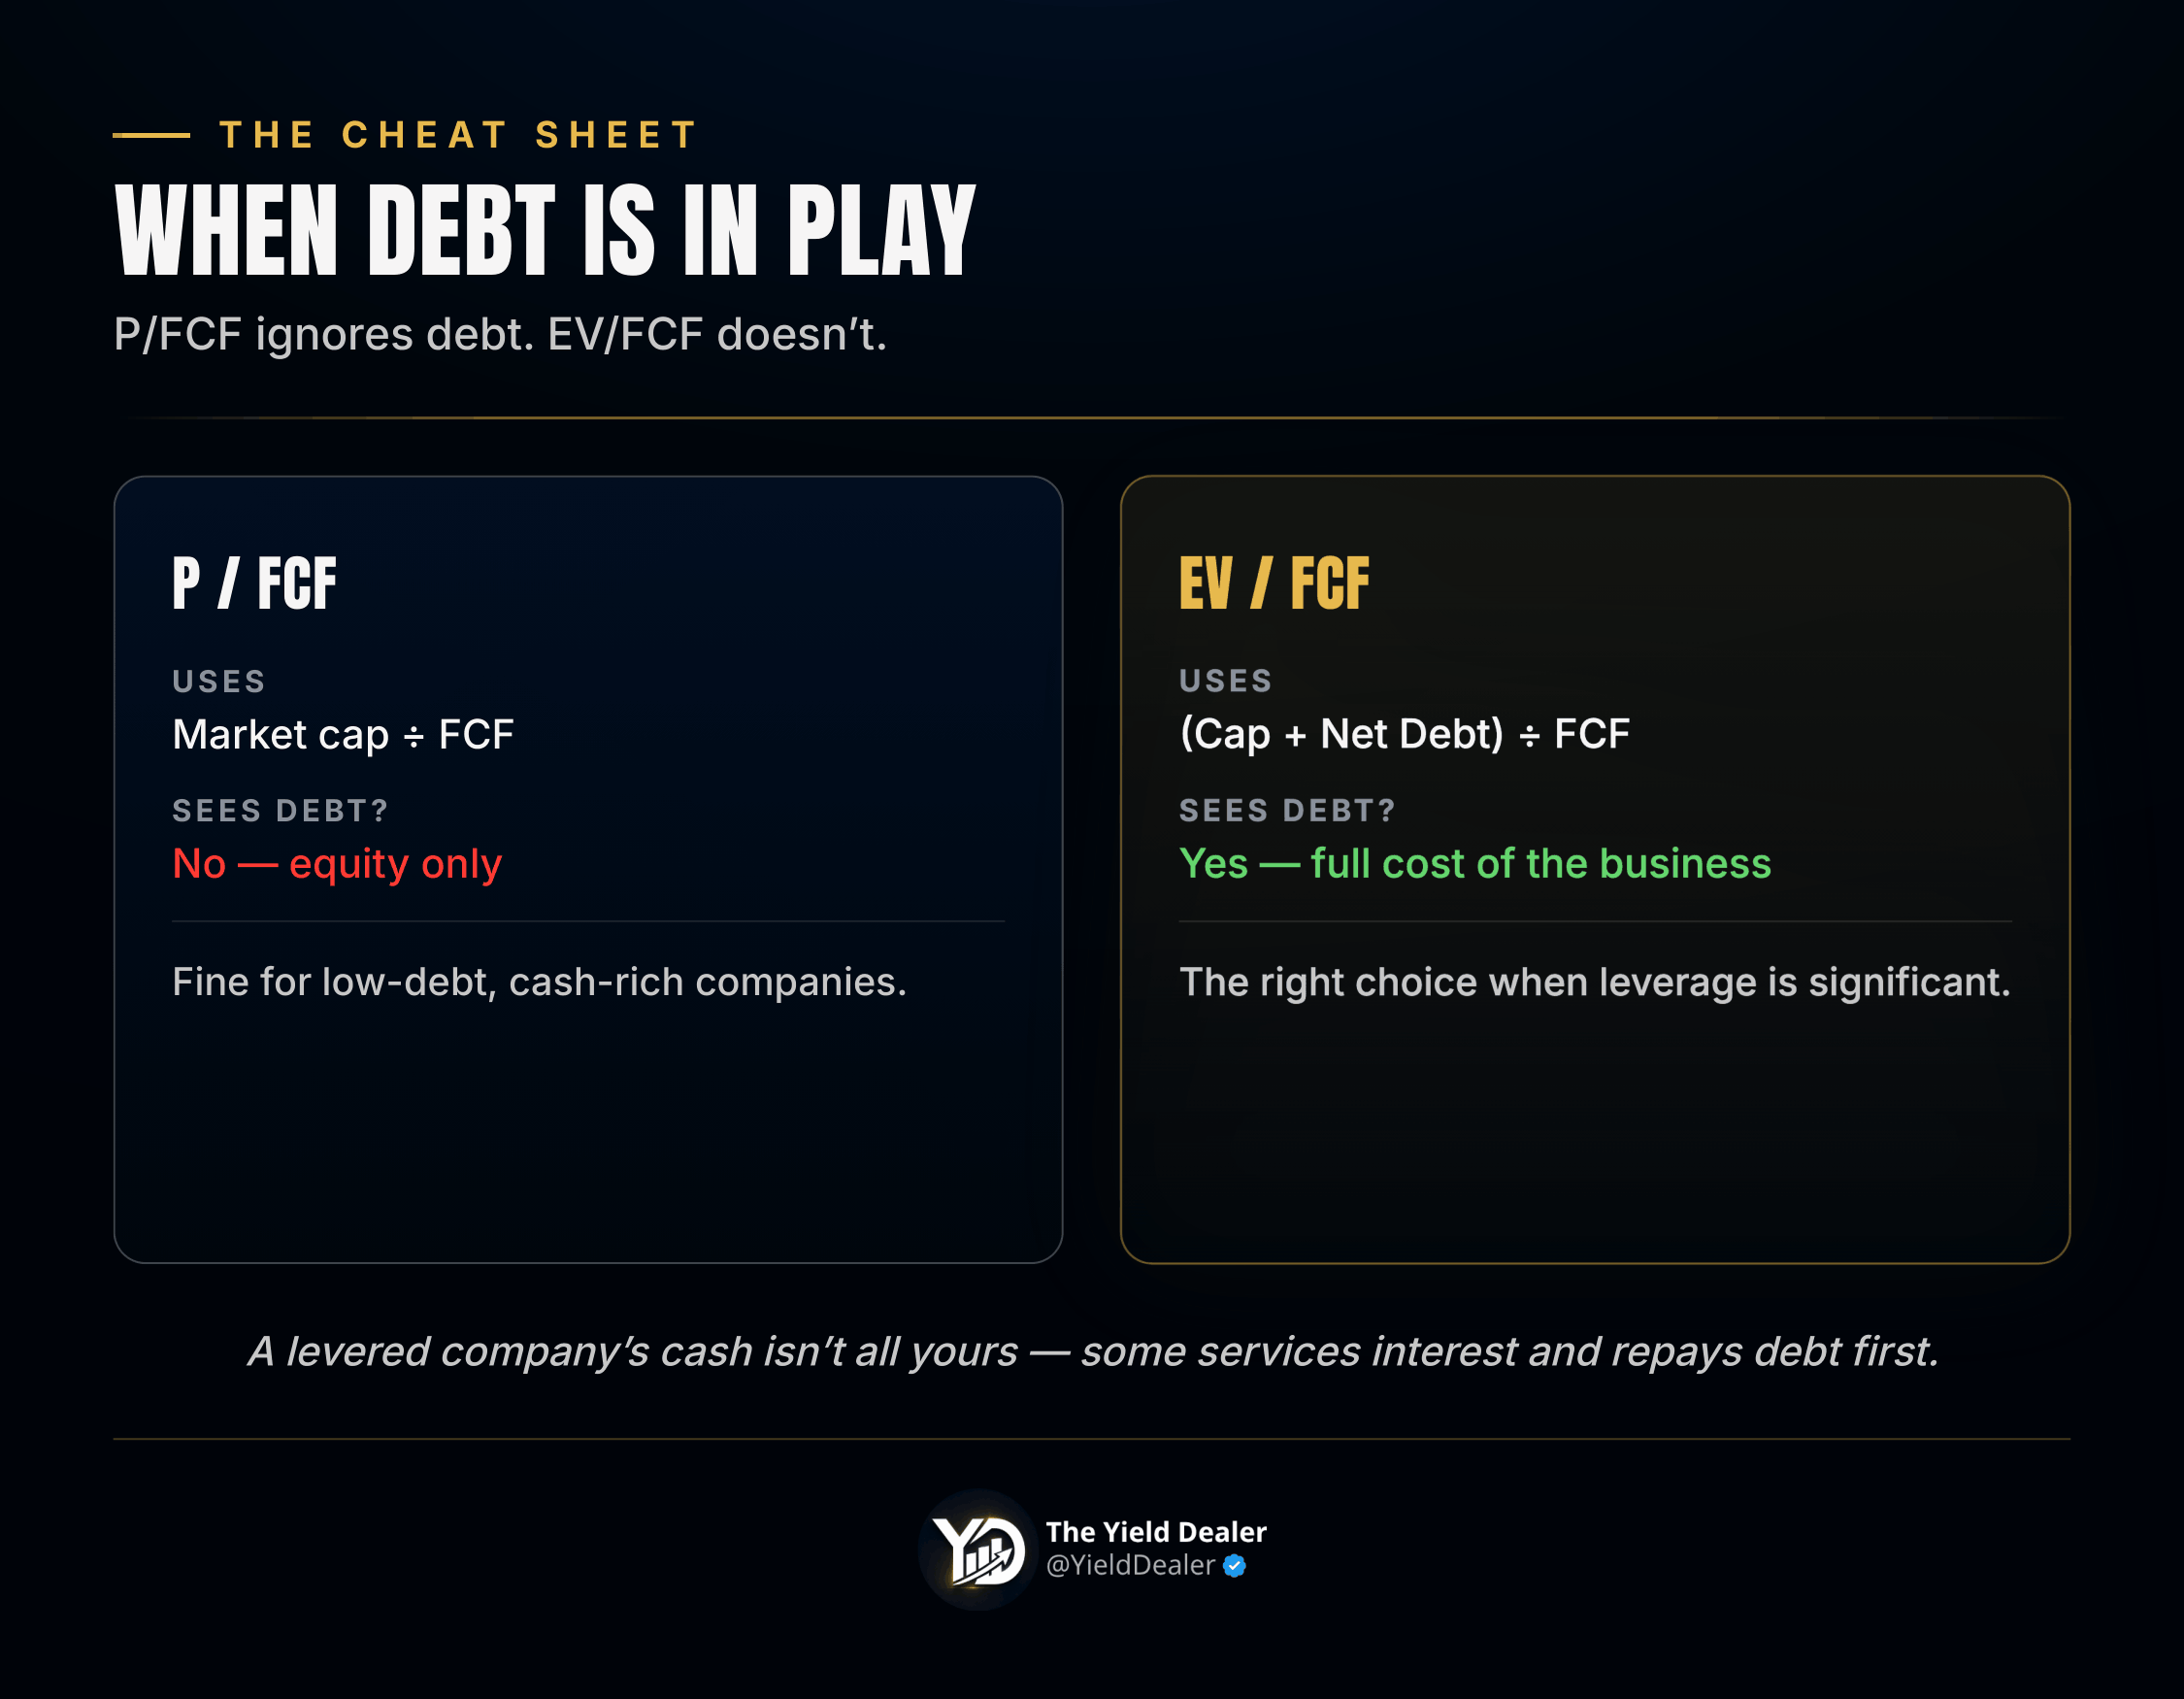
That’s why many investors prefer EV/FCF, which uses Enterprise Value (market cap + net debt) instead of market cap. It captures the true cost of buying the whole business. For heavily indebted companies, EV/FCF is usually the better tool. P/FCF stays useful — but always pair it with a look at the balance sheet.
Watch the quality of the cash flow
A P/FCF is only as good as the FCF behind it — and FCF can be flattered.
One weak or exceptional year distorts everything. FCF can spike in a year when CapEx was light, inventory shrank, or customers paid faster — and crater the next. Never rely on a single year. Three years give a first read; five to ten give a real picture, especially for cyclicals. Ask whether the FCF is normal, unusually high, or unusually low — and consider averaging across years. A company at 8× FCF looks cheap, but if that FCF is exceptional and set to halve, the normalized multiple is really 16×.
Beware artificially low CapEx. A company can temporarily boost FCF by slashing investment — deferring factory maintenance, underinvesting in stores, starving its tech infrastructure. FCF looks great for a few years, but the bill always comes due, and competitiveness can erode in the meantime. Distinguish maintenance CapEx (essential, keeps the lights on) from growth CapEx (more discretionary). Financial statements rarely separate them cleanly — judgment required. High FCF from underinvestment is not the same quality as high FCF from a naturally asset-light model.
P/FCF vs P/E — look at both
The P/E compares price to net income — well known, but net income is shaped by depreciation, provisions, one-off items, taxes, and impairments. It can be high while the company generates little cash, or low while it produces plenty.
The FCF check tells you whether earnings are actually turning into cash. A company posting strong net income but weak FCF deserves scrutiny — it can signal heavy investment, rising inventory, slow-paying customers, low earnings quality, or a more capital-hungry model than it appears. Conversely, a company with temporarily depressed net income (from non-cash charges) can still generate solid FCF, and P/FCF gives the truer picture.
Look at both. When they tell the same story, you can be more confident. When they diverge sharply, find out why — the gap is often the real insight.
What the company does with the cash
P/FCF tells you what the market pays for the cash generated — not what management does with it. That matters enormously. Free cash flow can fund dividends, buybacks, debt repayment, internal growth, or acquisitions — and these are not equally valuable.
Generating cash is a strength. Allocating it well is what turns that strength into shareholder value.
A dividend can be attractive but shouldn’t starve necessary investment. Buybacks create real value when the stock is undervalued and destroy it when done at inflated prices (a very common and very American habit worth scrutinizing). Acquisitions can accelerate growth or torch capital if overpaid. FCF gives a company flexibility; the quality of management shows in how that flexibility is used.
The special case of banks and insurers
P/FCF is poorly suited to financial companies — banks and insurers especially. For them, “free cash flow” is far less meaningful: their business runs on deposits, loans, reserves, regulatory capital, and prudential requirements, and debt doesn’t mean what it does for an industrial firm. Cash-flow swings are hard to interpret and don’t reliably reflect economic performance.
For banks, use Price-to-Book, return on equity, loan-book quality, cost of risk, net interest margin, and solvency — and return on tangible equity.
For insurers, look at balance-sheet strength, the combined ratio, return on equity, investment-portfolio quality, and capital generation.
P/FCF is excellent for many industrial, tech, consumer, and services businesses — but it isn’t universal.
How to actually use P/FCF in your analysis
Check the current level. Cheap or expensive relative to the cash generated?
Compare to its own history. Richer or cheaper than its multi-year average — and is the difference justified by better or worse prospects?
Compare to direct peers. A premium must be earned: stronger growth, better margins, a sturdier balance sheet, better visibility, a stronger brand, higher returns on capital.
Judge the quality of the FCF. Regular? Tied to the core business? Supported by good earnings-to-cash conversion? CapEx sufficient? Working capital under control? Any one-off boosts?
Check the balance sheet. A low-debt company can weather downturns and use cash offensively; a levered one has far less freedom.
Bottom line
P/FCF is one of the most useful valuation ratios because it forces you to focus on a fundamental reality: available cash. A company can tell a great story, post impressive growth, and show attractive earnings — but if it doesn’t generate durable free cash flow, treat its economic value with caution. A business that reliably produces cash — and allocates it well — holds a powerful advantage.
The ratio links three essential things: the price paid, the cash actually generated, and the quality of the business model. It’s an excellent tool for an individual investor — as long as you don’t use it as an automatic rule. Compare it over time, against the sector, adjusted for debt, and in light of future prospects.
In the end, P/FCF helps answer one simple but decisive question: is the price you’re paying today reasonable relative to the cash this company can truly generate tomorrow?


Want to get The Yield Dealer’s Newsletter in your inbox? Join other readers here.
Want short ideas on living and working on your own terms? Follow me on X/Twitter and Instagram.