

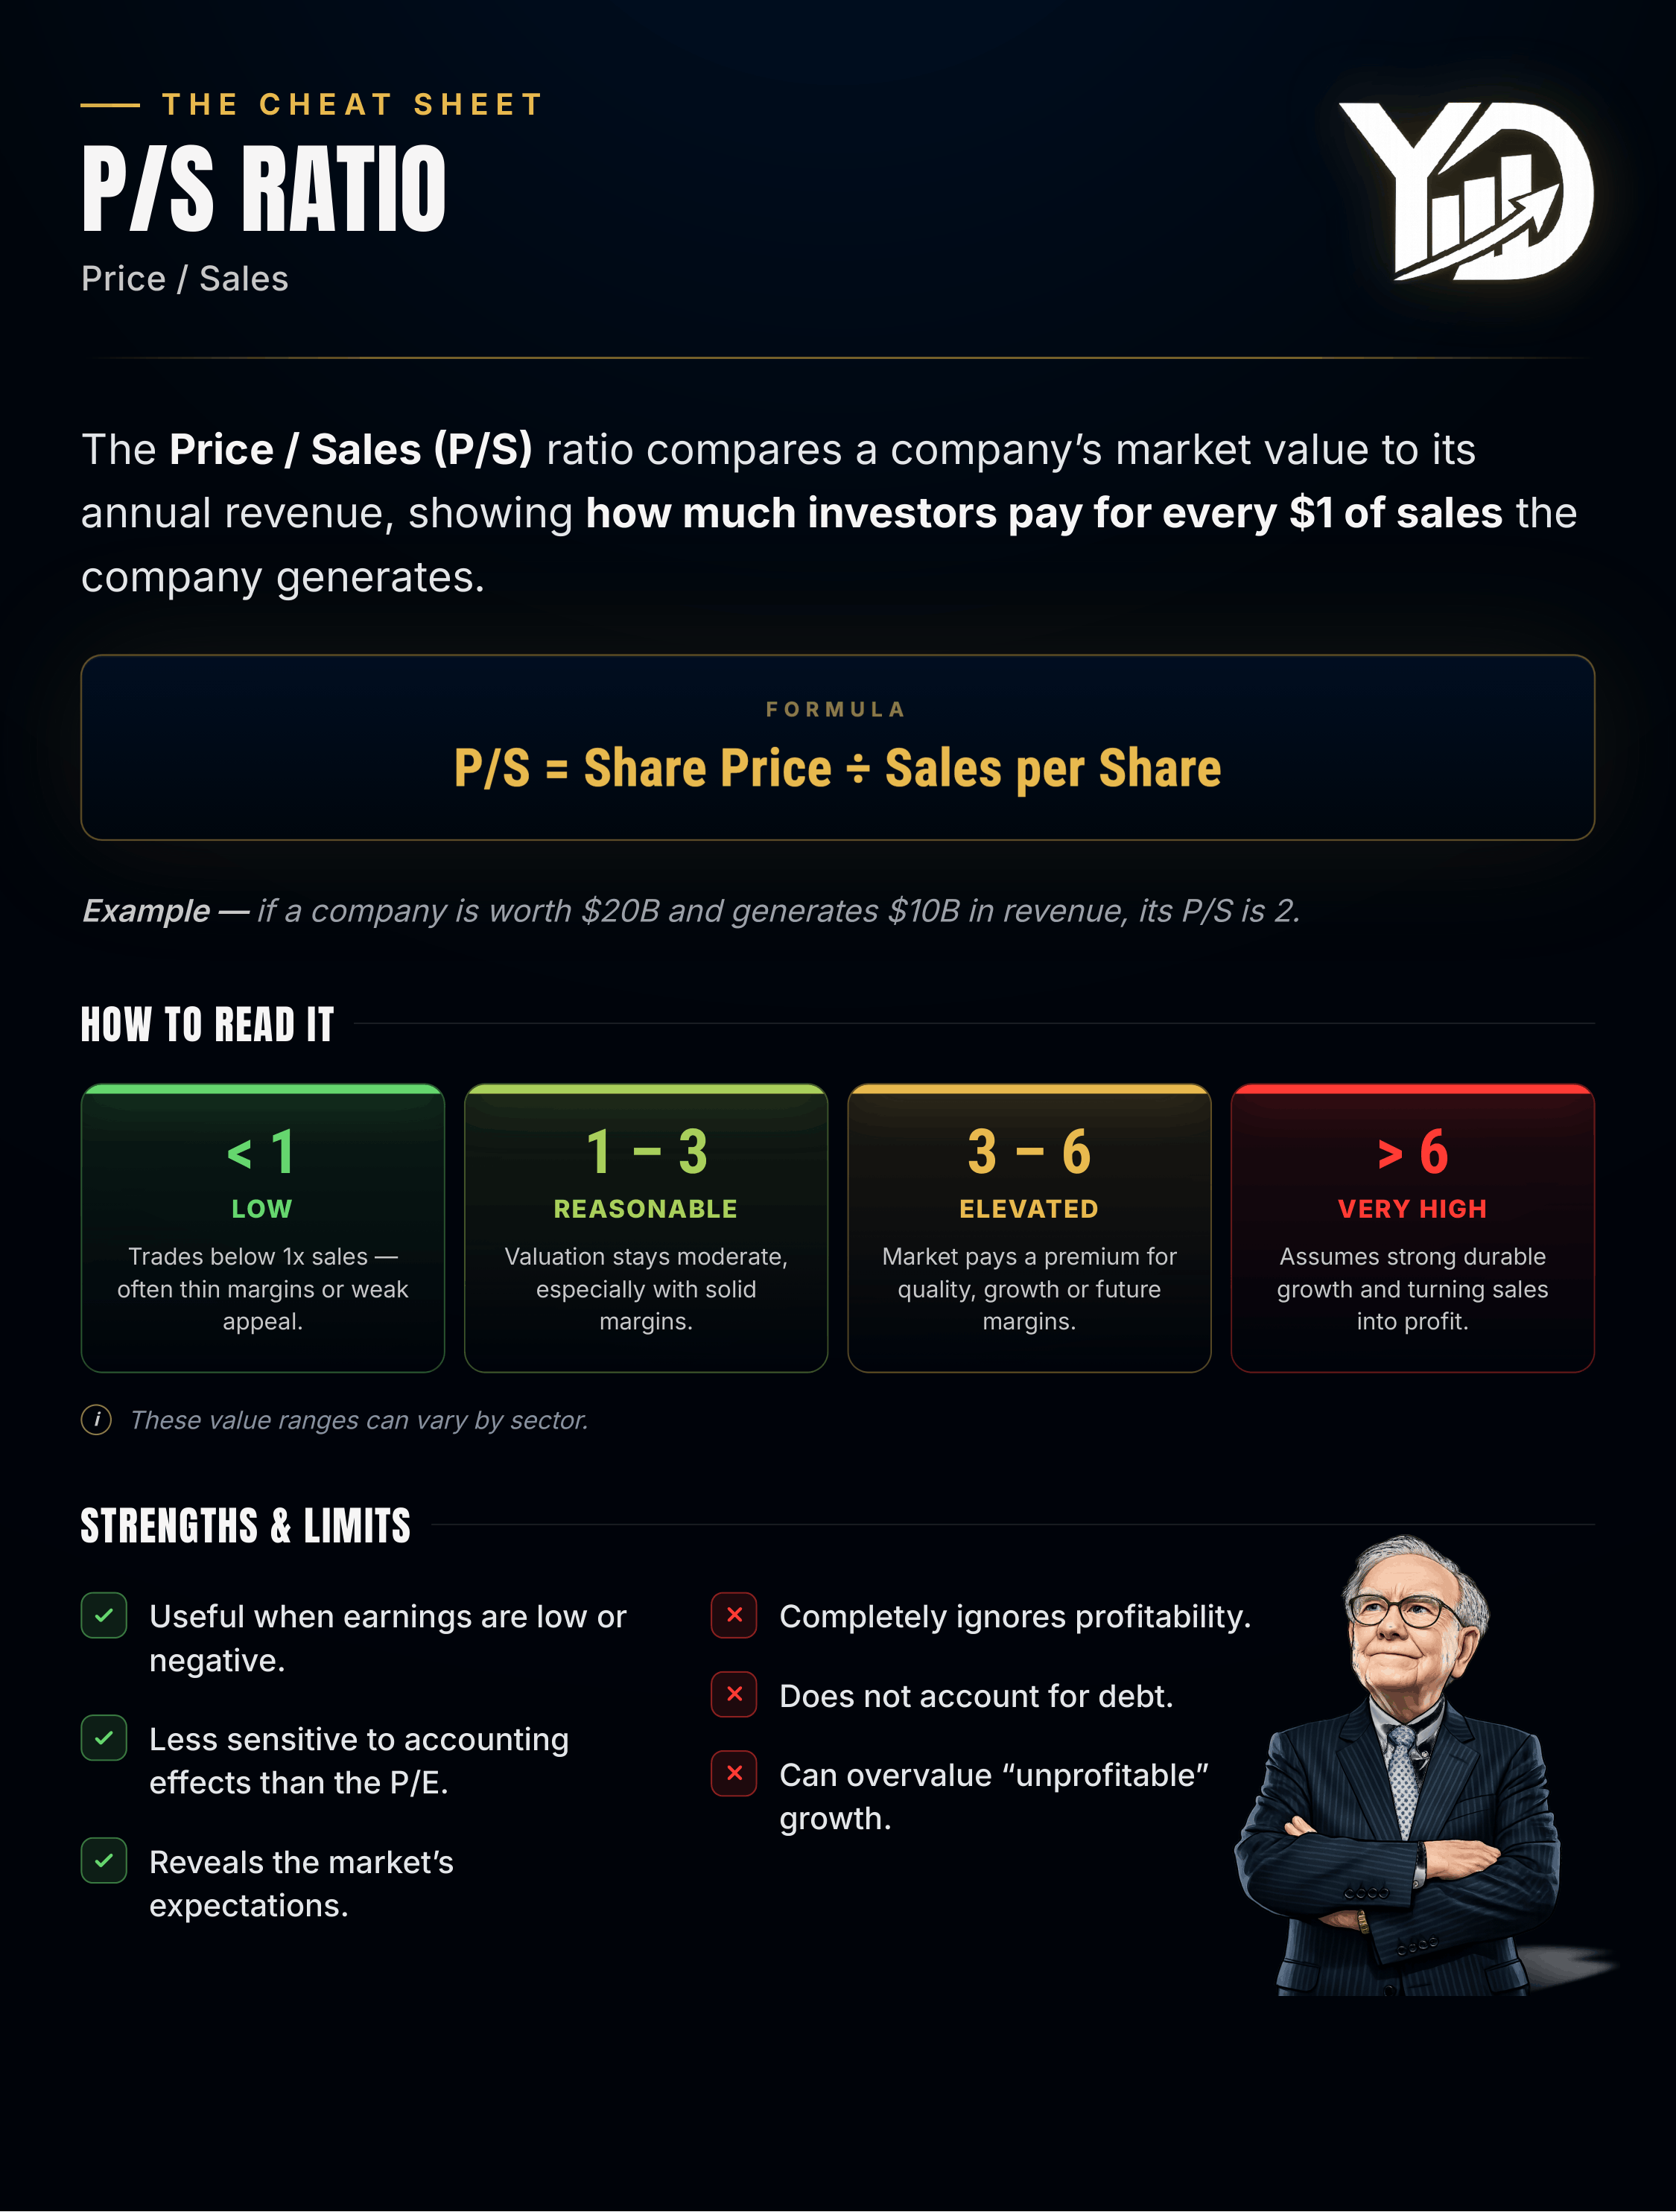
The Price-to-Sales ratio (P/S) compares a company’s stock-market value to its revenue. It answers one simple question: how much are investors willing to pay for every dollar of sales the business generates?
It’s a favorite tool for one specific situation — valuing companies that aren’t profitable yet. When there are no earnings to plug into a P/E, sales are often the only number left to anchor a valuation to. That’s why P/S shows up constantly in tech, software, e-commerce, biotech, and other high-growth corners of the US market. But it comes with a serious catch.
Revenue tells you what a company sells, not what it keeps.
The formula
P/S = Market Cap ÷ Revenue
Or, on a per-share basis:
P/S = Share Price ÷ Sales per Share
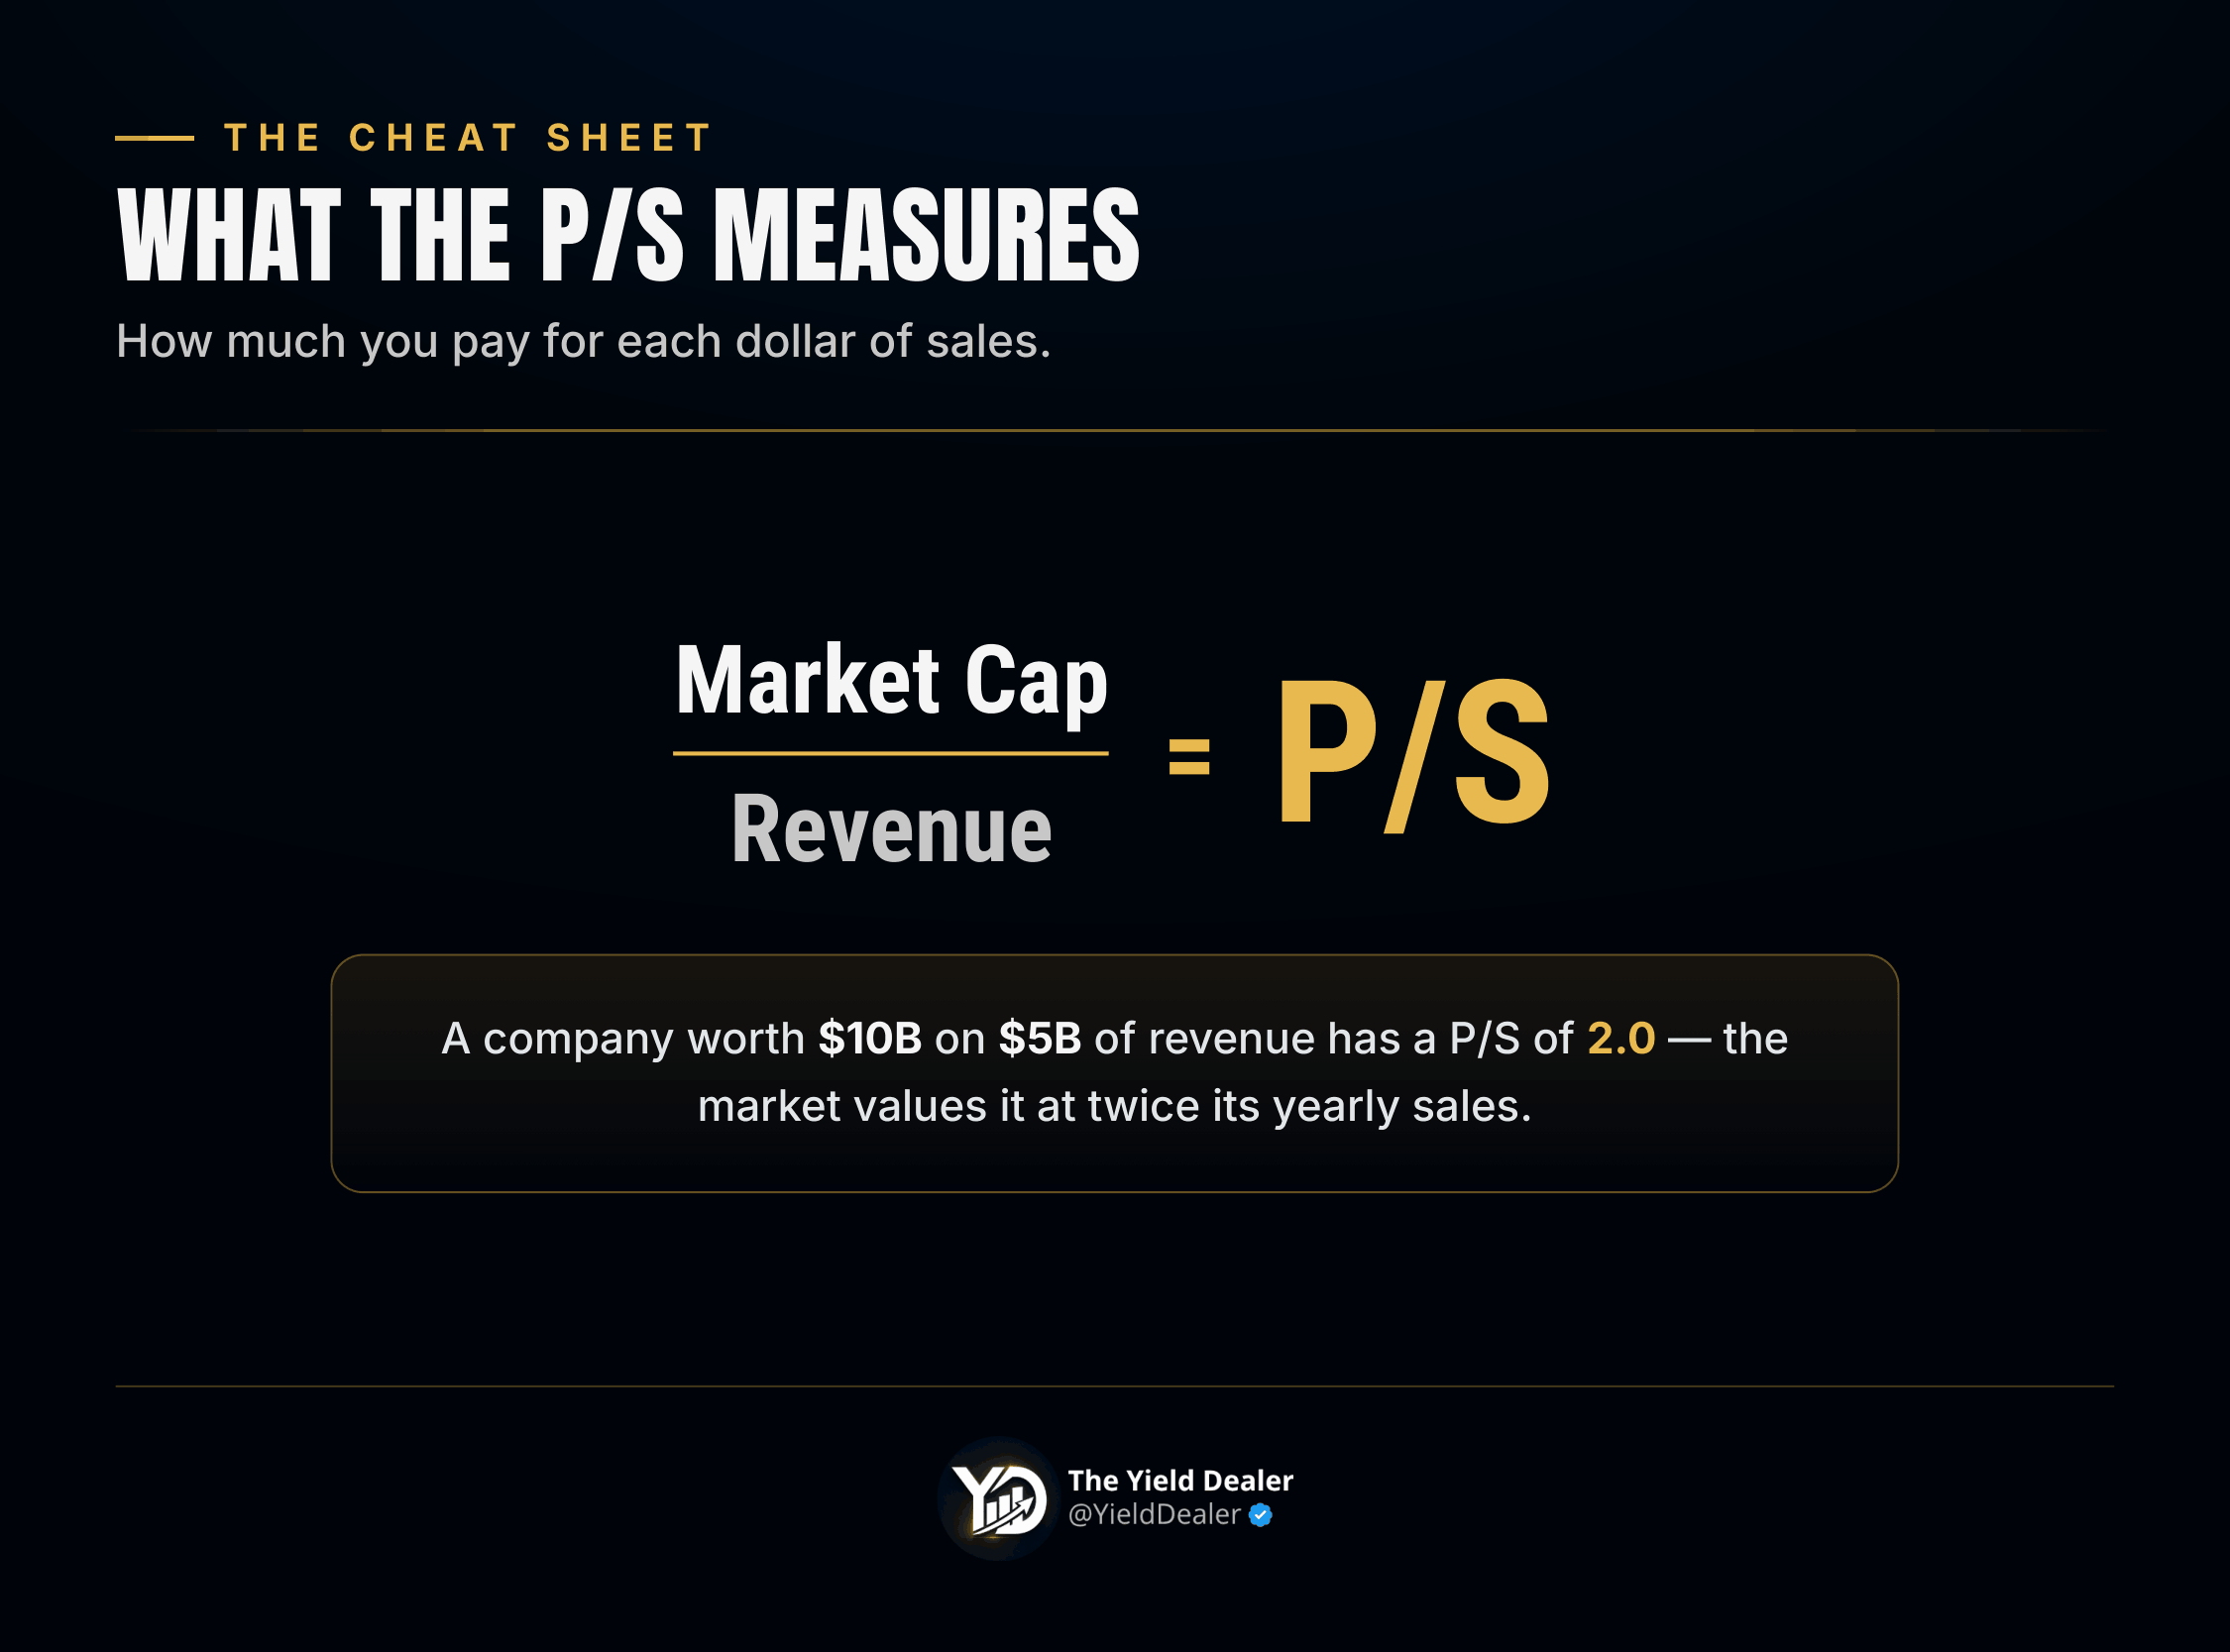
Example: A company worth $10B on the stock market generating $5B in annual revenue has a P/S of 2.0 — the market values it at twice its yearly sales.
🔎 Why investors use it
P/S has three real strengths:
It works when there are no earnings. Many young, fast-growing US companies are deliberately unprofitable — reinvesting everything into growth. P/E is useless there (you can’t divide by a negative number in any meaningful way), but revenue still exists, so P/S gives you something to work with.
Revenue is harder to manipulate than earnings. Net income can be shaped by depreciation choices, one-time items, tax effects, and accounting judgment. The top line is cleaner and more stable.
It’s simple and comparable. Easy to calculate, easy to line up against peers.
That’s why P/S became the default yardstick for the entire software-and-cloud universe, where “growth now, profits later” is the whole business model.
The trap: a sale isn’t a profit
Here’s the mistake that sinks investors: revenue means nothing without margins.
A company can sell a lot and keep almost none of it. It can even lose money on every sale. Two companies with identical revenue can be worlds apart:
🟢 Company A — $1B in sales at a 30% operating margin → $300M of operating profit.
🔴 Company B — $1B in sales at a 3% operating margin → $30M of operating profit.
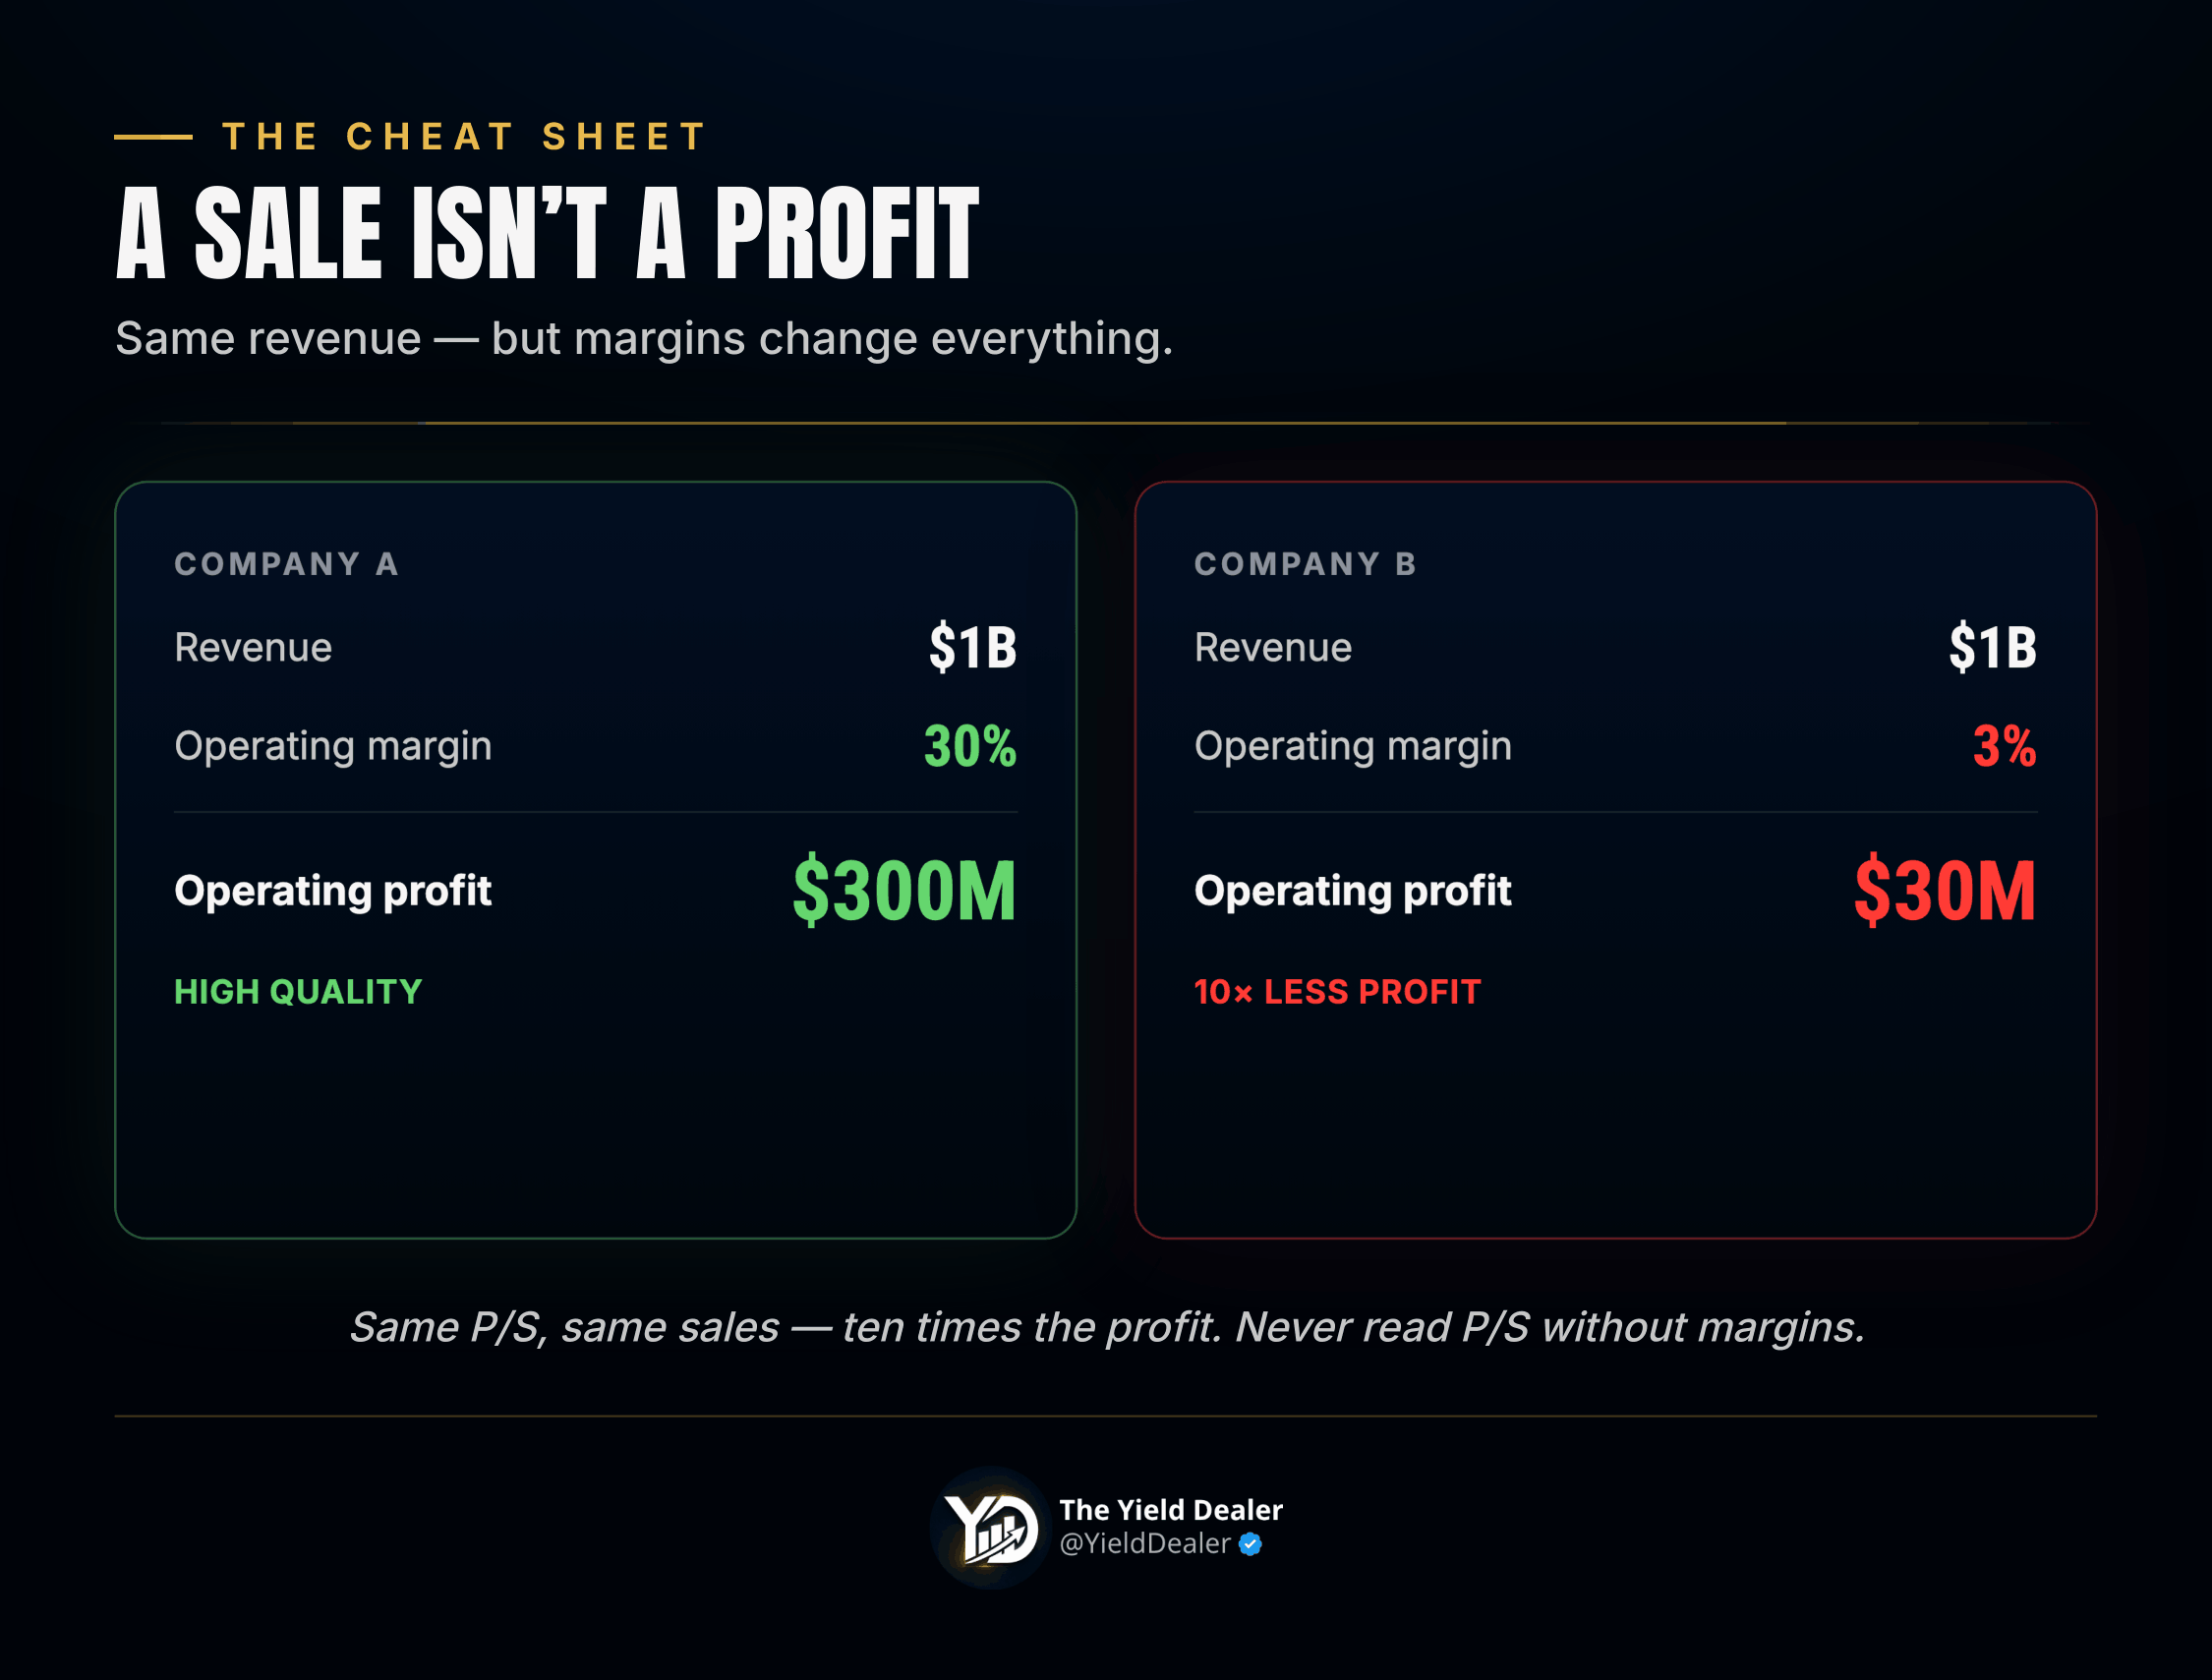
Same revenue. Ten times the profit. Yet on P/S alone, they can look identical. What matters isn’t selling — it’s turning those sales into profit and cash. A low P/S can look like a bargain while hiding a business that barely makes money on anything it sells.
When a high P/S is justified — and when a low one isn’t
A high P/S can be perfectly rational if the company grows fast, has high potential margins, owns a durable competitive advantage, and has strong visibility into future revenue. The market is paying up for today’s sales because it expects far bigger profits tomorrow. This is exactly how the market values high-quality software companies — a P/S of 10 or 15 isn’t automatically crazy if the business is growing 40% a year with 80% gross margins and recurring revenue.
A low P/S is not automatically cheap. It often reflects thin margins, brutal competition, slow growth, or a fragile business model. The market isn’t just valuing the sales — it’s valuing the odds those sales ever become real profit.
Context is everything: compare within a sector
P/S is only meaningful against comparable companies. A P/S of 5 can be reasonable for a high-margin software firm with recurring revenue. That same P/S of 5 would be absurd for a grocery chain, where margins run 1–3%. Grocers and retailers routinely trade at a P/S below 1 — not because they’re cheap, but because a dollar of their sales is worth far less in profit than a dollar of software revenue.
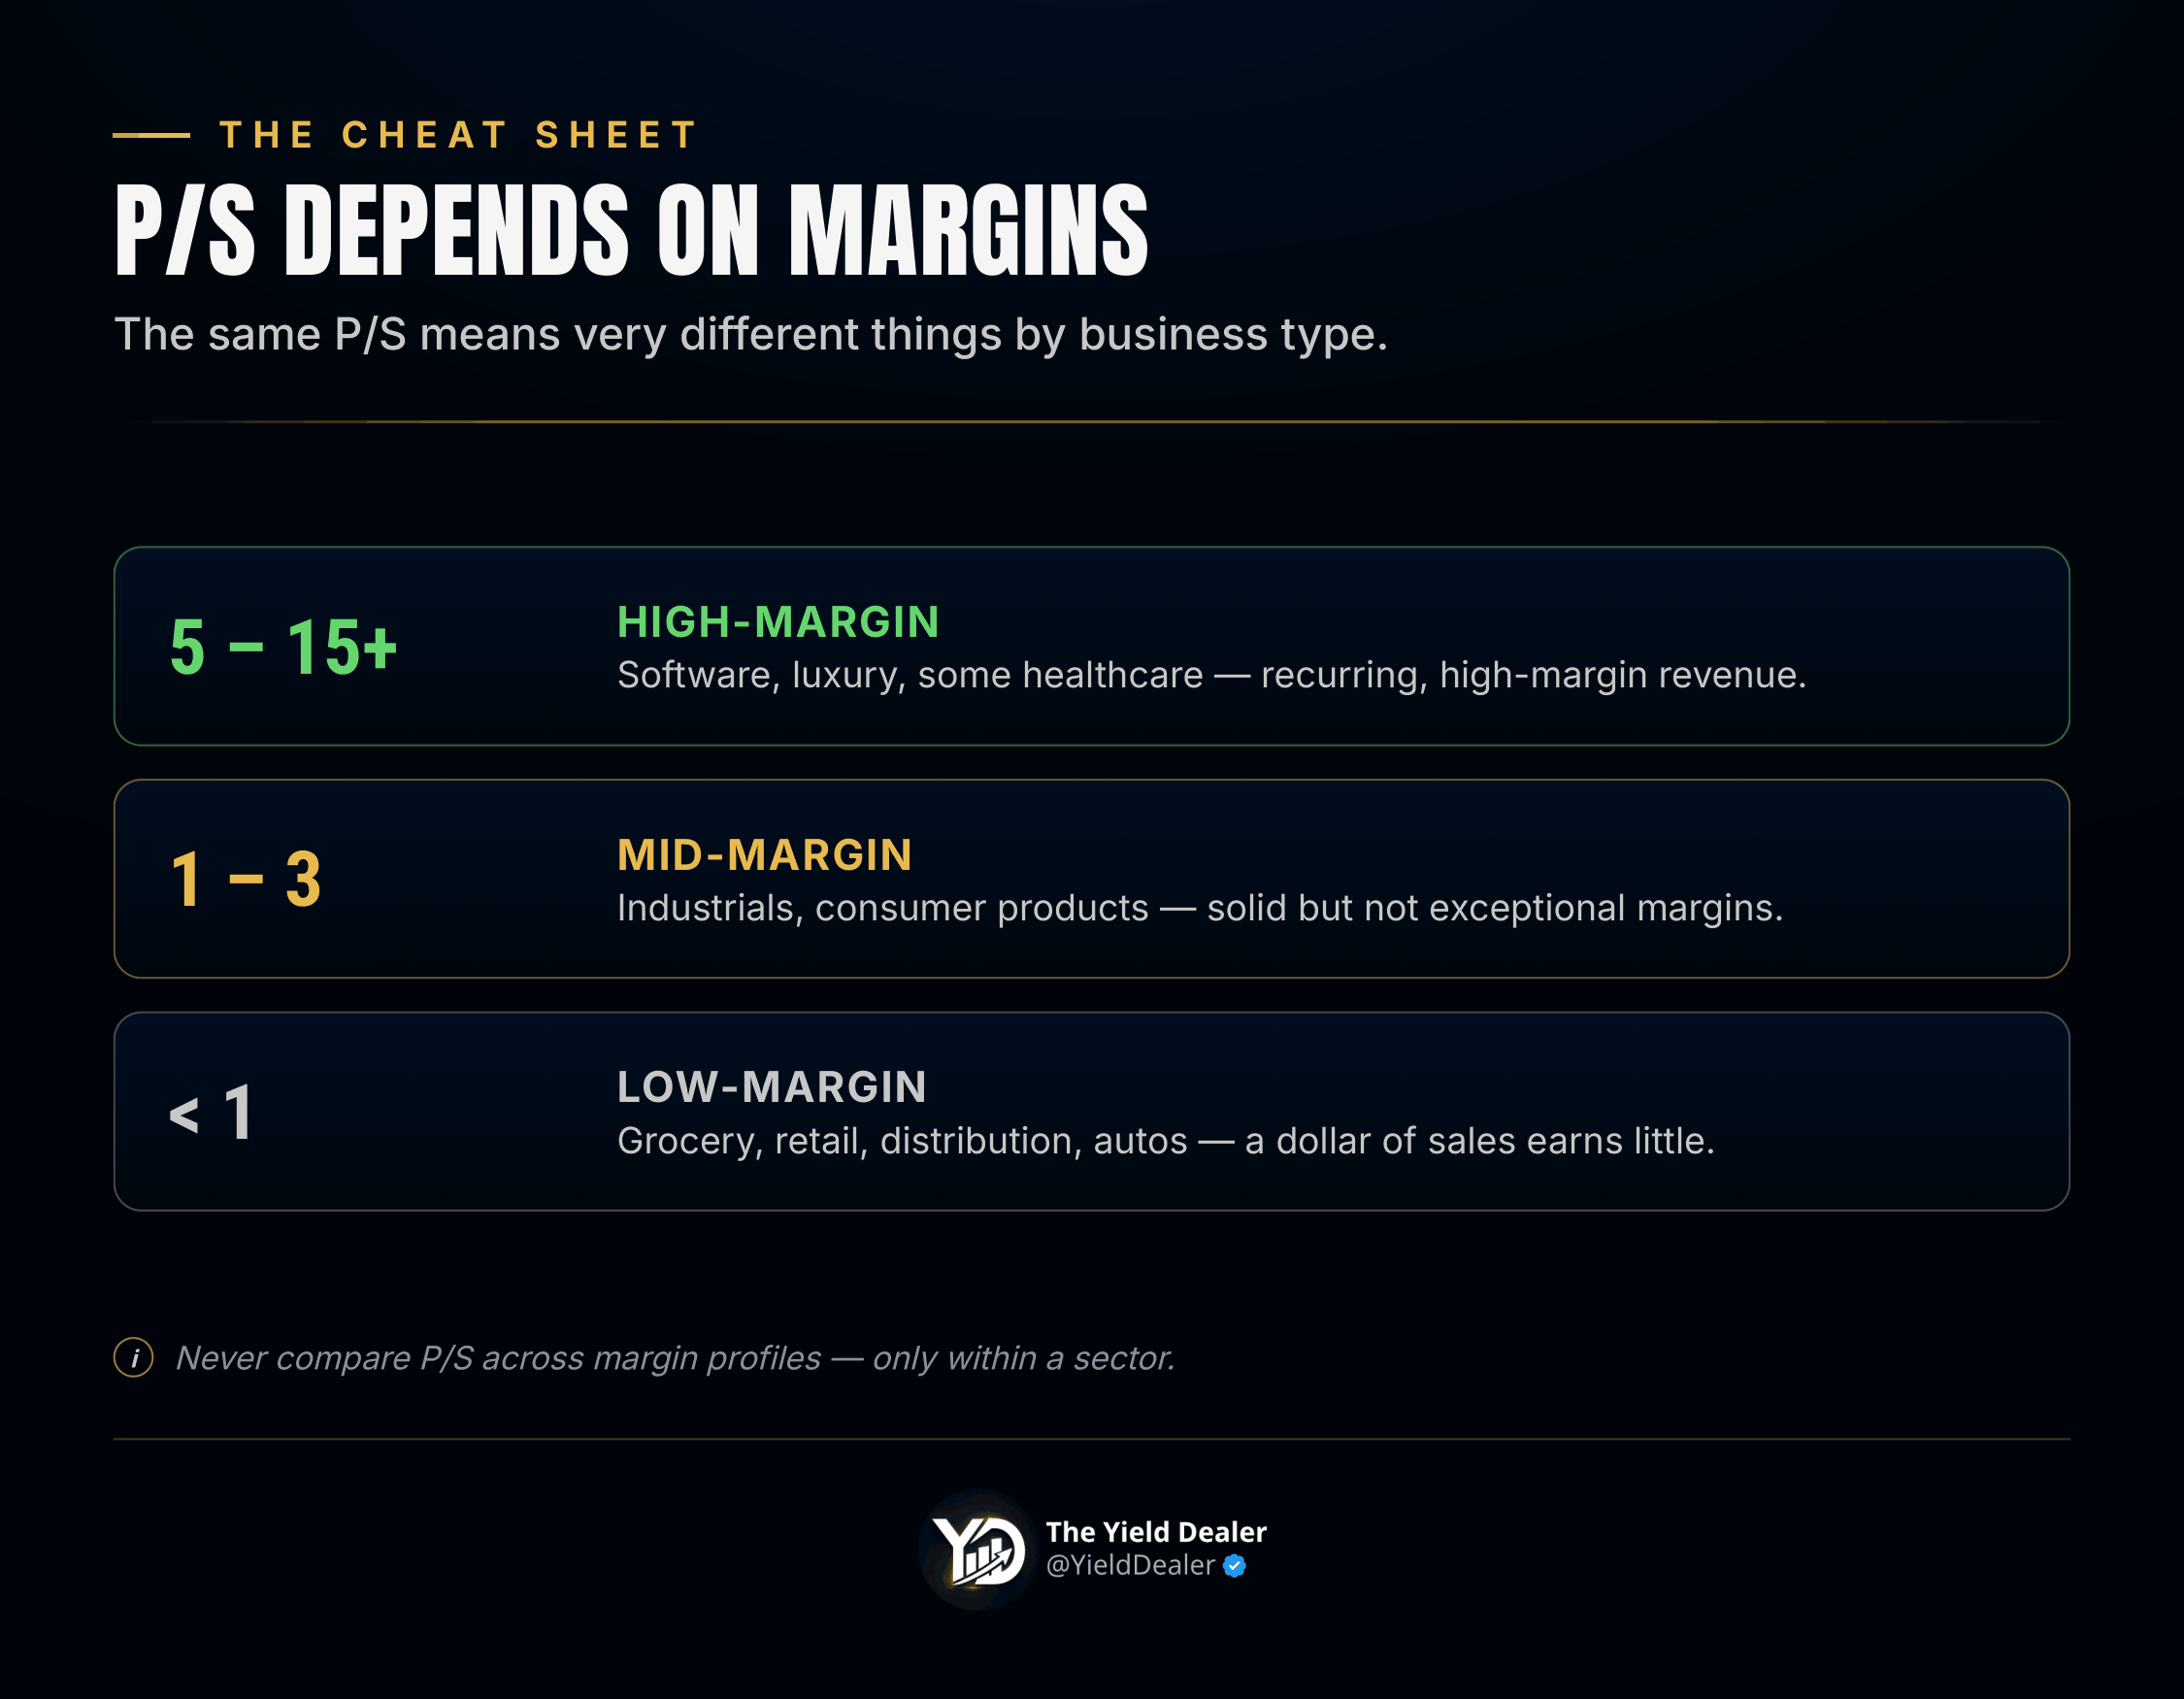
Rule of thumb by margin profile:
🟢 High-margin (software, luxury, some healthcare): P/S can run high — 5, 10, even higher — and still be fair.
🟡 Mid-margin (industrials, consumer products): typically 1–3.
⚪️ Low-margin (grocery, retail, distribution, autos): usually well under 1.
Comparing P/S across these groups tells you nothing. Comparing a company to its direct peers and its own history tells you a lot.
Watch the debt: P/S vs EV/Sales
Standard P/S uses market cap, which ignores debt entirely. Two companies can show the same P/S, but if one is loaded with debt and the other is sitting on a pile of cash, they carry very different risk.
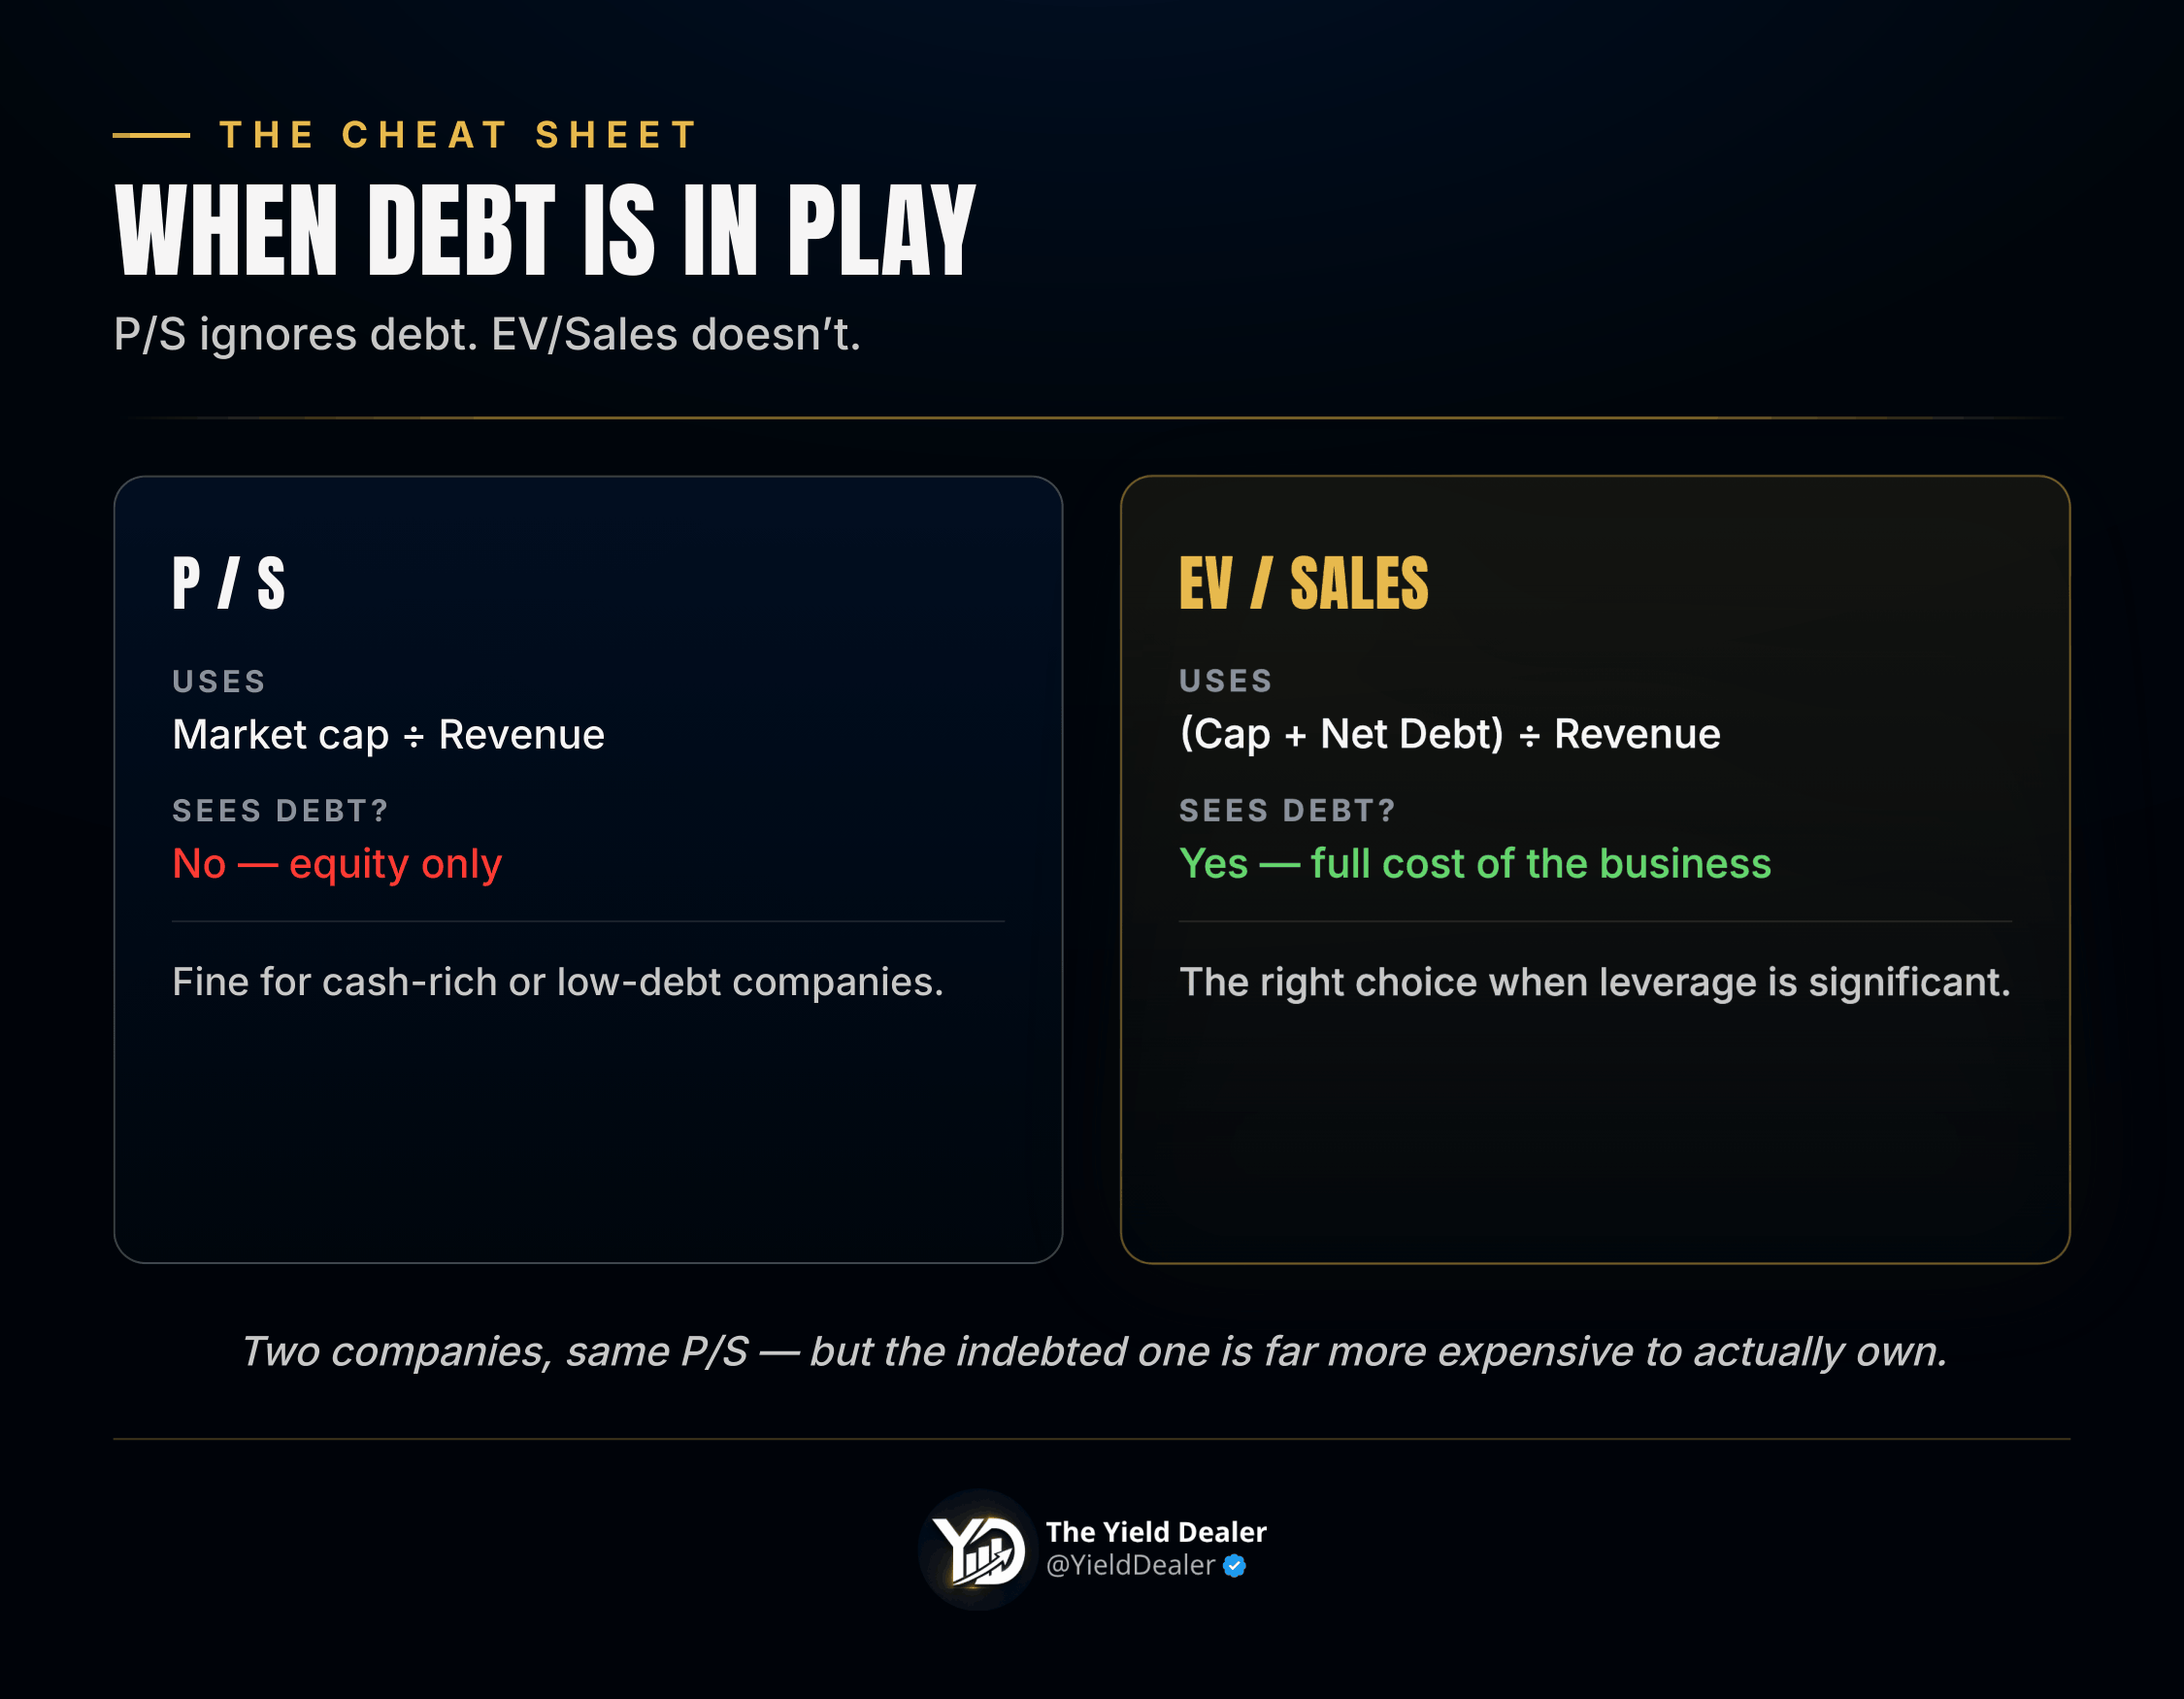
That’s why professionals often prefer EV/Sales, which uses Enterprise Value (market cap + net debt) instead of market cap. It captures the full cost of owning the business, debt included — the same logic that makes EV/EBITDA more complete than the P/E. For a heavily indebted company, EV/Sales can look far less attractive than its P/S suggests. If leverage is in play, use EV/Sales.
The best use case: temporary or negative earnings
P/S earns its keep when profits are temporarily depressed or negative — a young growth company reinvesting everything, or a cyclical business at the bottom of its cycle. In those moments, the P/E is broken or misleading, and P/S gives you a stable anchor to value the business.
But even then, it’s a starting point, never a verdict. You still have to ask: what’s the path to profitability? Are gross margins strong enough to eventually produce real earnings? Is the company burning cash to buy revenue it can’t sustain?
How to actually use P/S in your analysis
Pair it with margins — always. P/S without a look at gross and operating margins is meaningless. The whole question is what those sales will eventually earn.
Compare within a sector, to direct peers and to the company’s own history — never across margin profiles.
Use EV/Sales when debt matters, to account for the full cost of the business.
Interrogate a low P/S. Ask why it’s low: a genuine opportunity, or a structurally low-margin, low-growth business?
Check the path to profit. For an unprofitable company, a reasonable P/S only matters if there’s a credible route from revenue to real earnings and free cash flow.
Bottom line
The P/S ratio tells you how much the market is paying for a company’s sales. It’s genuinely useful — especially for growth companies and businesses that aren’t profitable yet, where the P/E simply doesn’t work. Revenue is also harder to manipulate than earnings, which makes P/S a cleaner first read.
But a sale only has value if it can one day become profit and cash. So don’t hunt for the lowest P/S — understand why the market values a company where it does. A low P/S can hide an opportunity, or a business that’s structurally unprofitable. A high P/S can look expensive, yet be fully justified by strong growth and future margins.
The ratio gives you the number. The analysis gives you the meaning.


Want to get The Yield Dealer’s Newsletter in your inbox? Join other readers here.
Want short ideas on living and working on your own terms? Follow me on X/Twitter and Instagram.